Debugging Memory Issues#
Debugging Out of Memory#
Before reading this section, familiarize yourself with the Ray Memory Management model.
If your cluster has out-of-memory problems, view How to Detect Out-of-Memory Errors.
To locate the source of the memory problems, view Find per Task and Actor Memory Usage.
Once you’ve identified the source, address it at Eliminating worker out-of-memory errors.
If your head node has high memory usage, view Head Node Out-of-Memory Error.
If your memory usage is high due to high parallelism, view Reduce Parallelism.
If you want to profile per Task and Actor memory usage, view Profile Task and Actor Memory Usage.
What’s the Out-of-Memory Error?#
Memory is a limited resource. When a process requests memory and the OS fails to allocate it, the OS executes a routine to free up memory by killing a process that has high memory usage (via SIGKILL) to avoid the OS becoming unstable. This routine is called the Linux Out of Memory killer.
For Ray, the Linux out-of-memory (OOM) killer kills Ray processes without the control plane noticing. This causes the following problems:
The Linux OOM killer indiscriminately kills processes based on memory footprint. For Ray, this can result in significant loss of progress and, in some scenarios, in the death of critical Ray components, which leads to node deaths.
The Linux OOM killer uses SIGKILL to kill processes. Because processes can’t handle SIGKILL, Ray has difficulty raising a proper error message and taking proper actions for fault tolerance.
To solve this problem, Ray has (from Ray 2.2) an application-level memory monitor, which continually monitors the memory usage of the host and kills the Ray Workers before the Linux out-of-memory killer executes.
Detecting Out-of-Memory errors#
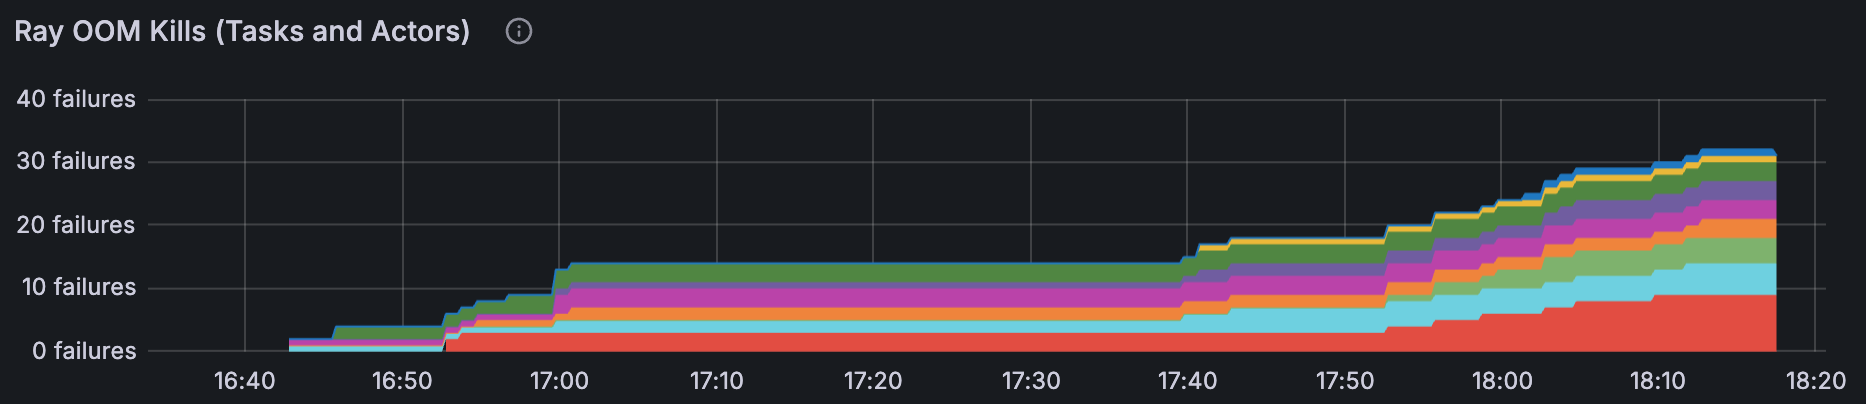
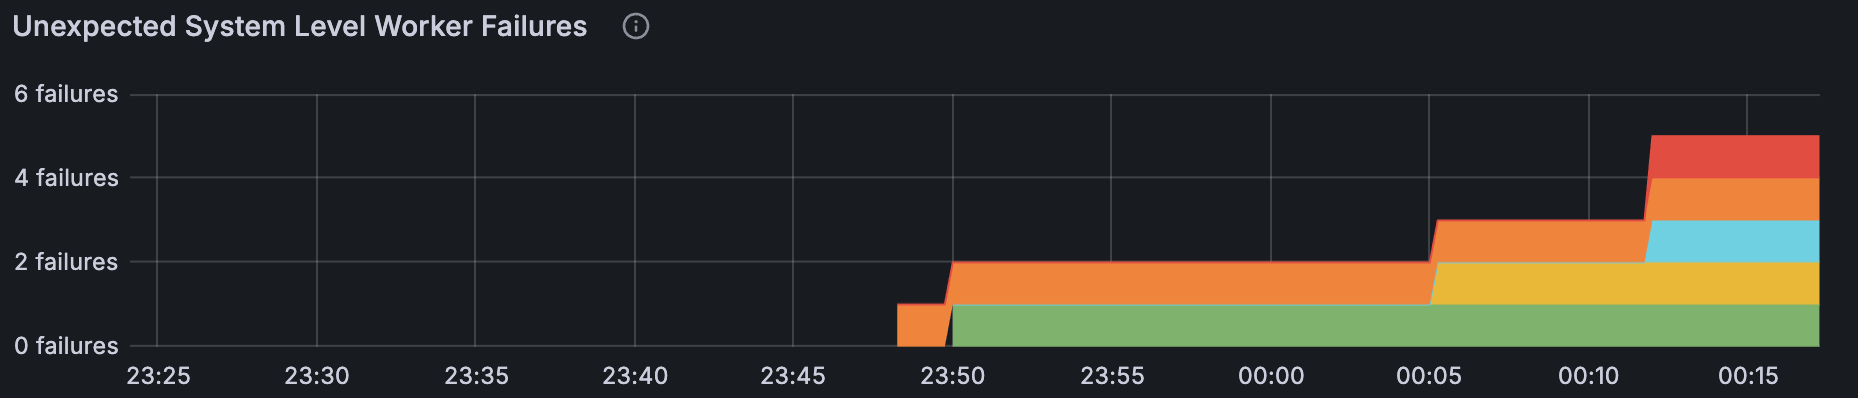
You can monitor out-of-memory errors on the Ray Dashboard’s metrics page via the Ray OOM Kills panel and the Unexpected System Level Worker Failures panel. The Ray OOM Kills panel shows the number of workers killed by the Ray OOM killer. The Unexpected System Level Worker Failures panel shows the number of workers that failed unexpectedly. These failures are typically caused by the Linux out-of-memory killer; correlate with memory usage metrics to confirm.
If the Linux out-of-memory killer terminates Tasks or Actors, Ray Worker processes are unable to catch and display an exact root cause
because SIGKILL cannot be handled by processes. If you call ray.get into the Tasks and Actors that were executed from the dead worker,
it raises an exception with one of the following error messages (which indicates the worker is killed unexpectedly).
Worker exit type: UNEXPECTED_SYSTEM_EXIT Worker exit detail: Worker unexpectedly exits with a connection error code 2. End of file. There are some potential root causes. (1) The process is killed by SIGKILL by OOM killer due to high memory usage. (2) ray stop --force is called. (3) The worker is crashed unexpectedly due to SIGSEGV or other unexpected errors.
Worker exit type: SYSTEM_ERROR Worker exit detail: The leased worker has unrecoverable failure. Worker is requested to be destroyed when it is returned.
You can also use the dmesg CLI command to verify the processes are killed by the Linux out-of-memory killer.

As mentioned above, having the Linux OOM killer trigger before the Ray OOM killer is undesirable.
In Ray 2.56 and above, enable resource isolation mode by passing --enable-resource-isolation when starting Ray
to ensure that the Ray OOM killer triggers before the Linux OOM killer.
It’s still possible for Linux OOM kills to occur if the system overhead consumes more memory than what’s reserved for it (the default is 10%, with a minimum of 500 MB and a maximum of 10 GB). Ray logs something similar to the following example if it detects this scenario.
System slice memory usage 10869600256 bytes has exceeded the reserved system memory of 10737418240 bytes. This can prevent Ray from being able to provide the proper protection to critical system processes and can lead to node deaths and significant loss of progress. Please consider passing a system reserved memory value that is higher than the current system slice memory usage via the --system-reserved-memory flag when starting the raylet.
When you see a kernel OOM or this log message with resource isolation enabled, try increasing the memory reserved for system processes
by setting a higher value than the reported system slice memory usage for the --system-reserved-memory flag when starting Ray.
Try to allocate at least a GiB (depending on host size) of buffer space between the reported/expected system slice memory usage and the system reserved memory.
Note
To enable resource isolation, complete the prerequisite steps in How to Enable Cgroup v2 for Resource Isolation.
If Ray’s memory monitor kills the worker, Ray retries it automatically (see the retry policy for details).
Ray’s memory monitor also logs the details of the out-of-memory kill to the raylet.out log file.
An example log is shown below.
Task hungry_hippo failed due to oom. There are infinite oom retries remaining, so the task will be retried. Error: 2 worker(s) were killed due to the node running low on memory. Memory on the node (IP: <ip address>, ID: 92edc4e97e4dac3cee61126133ee7ab6d0a2ee73803623d24a02979d) was 110.69GB / 124.35GB (0.890161)
OOM kill reason: user cgroup memory upper bound was met or exceeded
Object store memory usage: [- objects spillable: 0
- bytes spillable: 0
- objects unsealed: 0
- bytes unsealed: 0
- objects in use: 0
- bytes in use: 0
- objects evictable: 0
- bytes evictable: 0

- objects created by worker: 0
- bytes created by worker: 0
- objects restored: 0
- bytes restored: 0
- objects received: 0
- bytes received: 0
- objects errored: 0
- bytes errored: 0

Eviction Stats:
(global lru) capacity: 35098657996
(global lru) used: 0%
(global lru) num objects: 0
(global lru) num evictions: 0
(global lru) bytes evicted: 0]
Ray killed 2 worker(s) based on the killing policy
Considered workers: [
Selected to kill: (Task: job ID=01000000, lease ID=0600000001000000ffffffffffffffffffffffffffffffffffffffffffffffff, task name=hungry_hippo, required resources={CPU: 1}, pid=3310152, actual memory used=0.67GB, worker ID=3e3d8f80b70d48b643d79ed2292b5d4f779820a964e55ad65413687d)
Selected to kill: (Task: job ID=01000000, lease ID=0400000001000000ffffffffffffffffffffffffffffffffffffffffffffffff, task name=hungry_hippo, required resources={CPU: 1}, pid=3310153, actual memory used=21.64GB, worker ID=0e5649d39c15609c0db6a5cf95de94befded2ee7da2facbf64b52e6f)
(Task: job ID=01000000, lease ID=0500000001000000ffffffffffffffffffffffffffffffffffffffffffffffff, task name=hungry_hippo, required resources={CPU: 1}, pid=3310151, actual memory used=21.95GB, worker ID=34241048bfb59ac29bd5e32d706c9bd41eafc6972c9bcbada99464e7)
(Task: job ID=01000000, lease ID=0000000001000000ffffffffffffffffffffffffffffffffffffffffffffffff, task name=hungry_hippo, required resources={CPU: 1}, pid=3310149, actual memory used=21.87GB, worker ID=2cc6dbeef4ebc06789de65fb43e04fbe1feebf1e699902ece89a8328)
(Task: job ID=01000000, lease ID=0200000001000000ffffffffffffffffffffffffffffffffffffffffffffffff, task name=hungry_hippo, required resources={CPU: 1}, pid=3310155, actual memory used=21.85GB, worker ID=14d4cc84e2f21ba3edbc9948b780d67013afbffda99dd33e829d56d3)
(Task: job ID=01000000, lease ID=0100000001000000ffffffffffffffffffffffffffffffffffffffffffffffff, task name=hungry_hippo, required resources={CPU: 1}, pid=3310147, actual memory used=21.53GB, worker ID=c90db9af23d78530d1f848c1301bc4b877925fe9122bc70948ad9489)]
Total non-selected idle workers: 25
Total non-selected idle workers USS bytes: 1.00GB
To see more information about memory usage on this node, use `ray logs raylet.out -ip <ip address>`
Top 10 memory users: PID  MEM(GB) COMMAND
3310151   21.95   ray::hungry_hippo
3310149   21.87   ray::hungry_hippo
3310155   21.85   ray::hungry_hippo
3310153   21.64   ray::hungry_hippo
3310147   21.53   ray::hungry_hippo
3108574   1.95    bazel
3180337   1.61    ray::foo_actor
3310152   0.67    ray::hungry_hippo
2924839   0.53    ray::idle_worker
3149737   0.47    ray::idle_worker
Refer to the documentation on how to address the out of memory issue: https://docs.ray.io/en/latest/ray-core/scheduling/ray-oom-prevention.html. Consider provisioning more memory on this node or reducing task parallelism by requesting more CPUs per task. To adjust the kill threshold, set the environment variable `RAY_memory_usage_threshold` when starting Ray. To disable worker killing, set the environment variable `RAY_memory_monitor_refresh_ms` to zero. Since 2.56, Ray updated the oom killing policy to enabling killing multiple workers and selecting workers based on the time since the task start executing. To revert to the legacy policy of determining worker to oom kill based on owner group size or only selecting a single worker to kill at a time, set the environment variable `RAY_worker_killing_policy_by_group` to true before starting Ray. If the idle workers have a non-trivial memory footprint at the time of OOM (check OOM log for non-selected idle workers), consider setting the environment variable `RAY_idle_worker_killing_memory_threshold_bytes` to a lower value to consider idle workers with lower memory footprint for killing.
If Tasks or Actors can’t be retried, they raise an exception with
a similar error message when you call ray.get on them.
Ray memory monitor also periodically prints the aggregated out-of-memory killer summary to Ray drivers.
(raylet) [2023-04-09 07:23:59,445 E 395 395] (raylet) node_manager.cc:3049: 10 Workers (tasks / actors) killed due to memory pressure (OOM), 0 Workers crashed due to other reasons at node (ID: e5d953ef03e55e26f13973ea1b5a0fd0ecc729cd820bc89e4aa50451, IP: 10.0.62.231) over the last time period. To see more information about the Workers killed on this node, use `ray logs raylet.out -ip 10.0.62.231`
(raylet)
(raylet) Refer to the documentation on how to address the out of memory issue: https://docs.ray.io/en/latest/ray-core/scheduling/ray-oom-prevention.html. Consider provisioning more memory on this node or reducing task parallelism by requesting more CPUs per task. To adjust the kill threshold, set the environment variable `RAY_memory_usage_threshold` when starting Ray. To disable worker killing, set the environment variable `RAY_memory_monitor_refresh_ms` to zero.
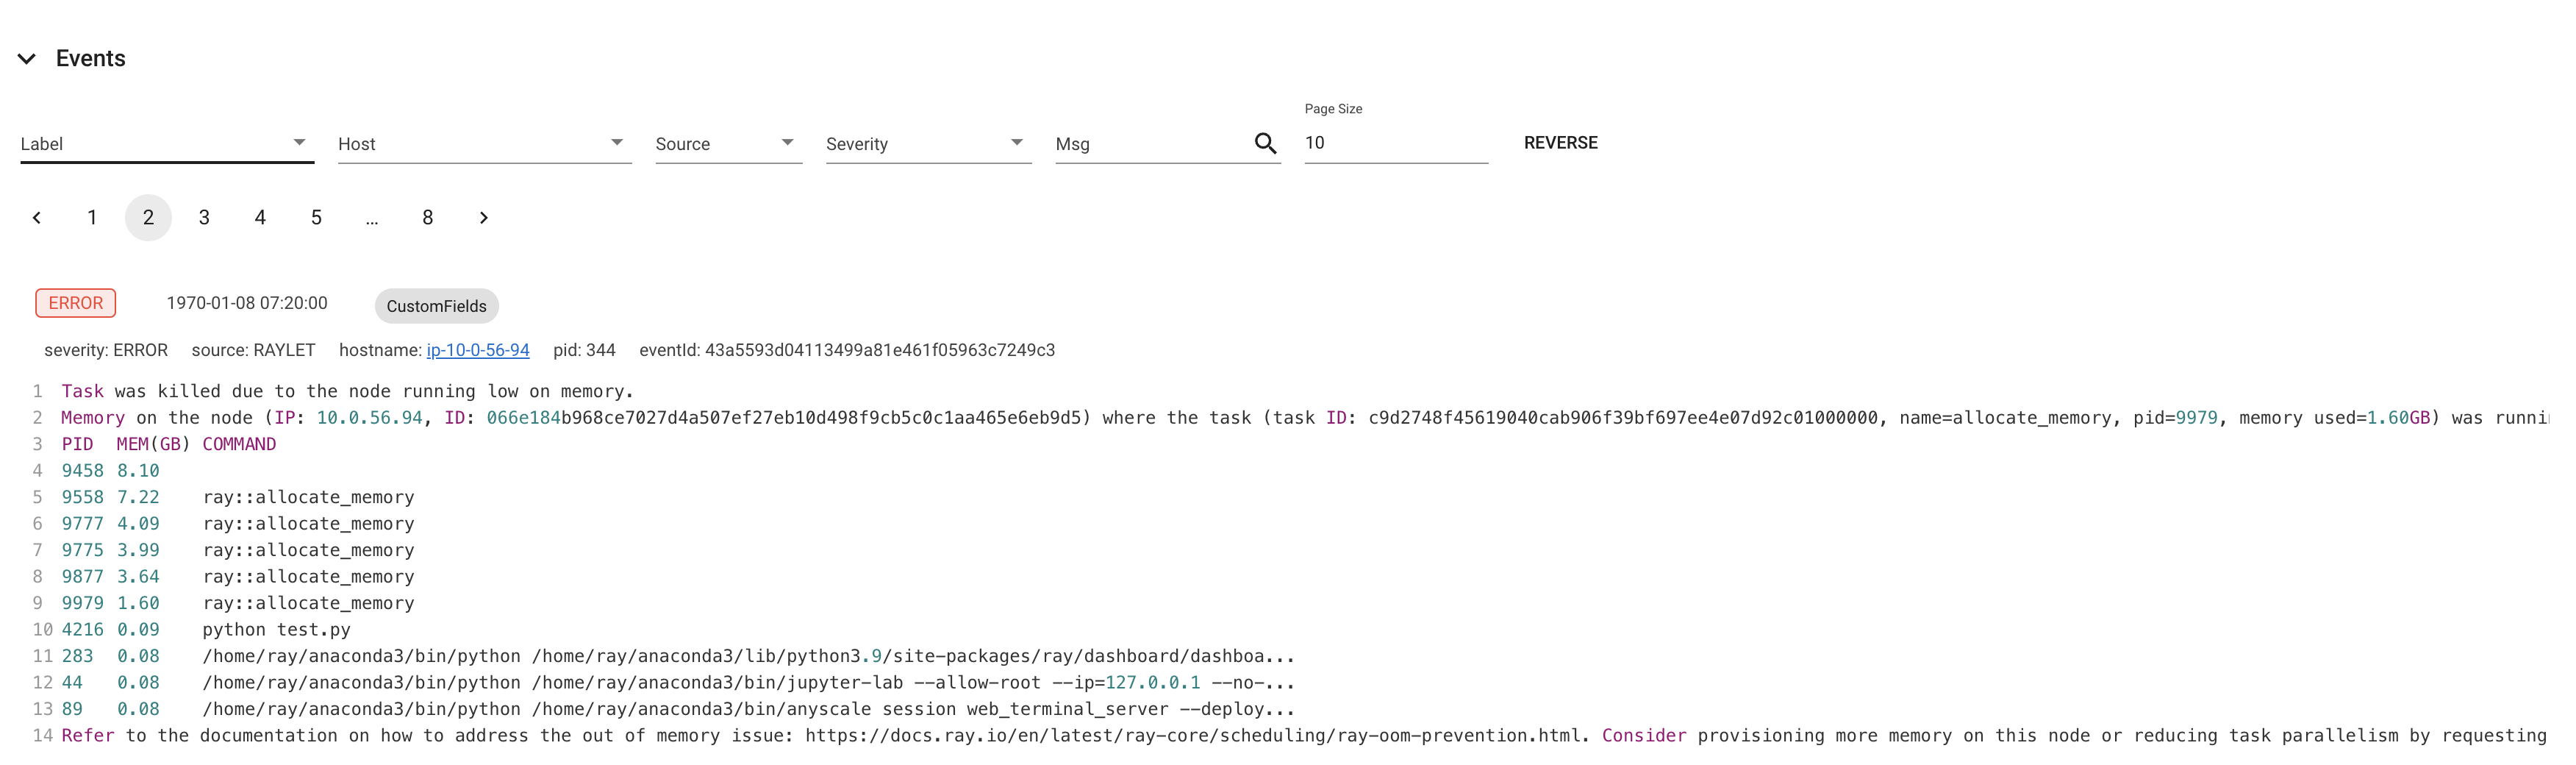
Ray Dashboard’s event page also provides the out-of-memory killer-specific events and metrics.
Find per Task and Actor Memory Usage#
If Tasks or Actors fail because of out-of-memory errors, they are retried based on retry policies. However, it is often preferred to find the root causes of memory issues and fix them instead of relying on fault tolerance mechanisms. This section explains how to debug out-of-memory errors in Ray.
To view the memory usage of tasks and actors at the time of OOM, see the considered workers in the OOM log above. This information helps identify the tasks and actors responsible for the OOM. The OOM log also includes the memory footprint of all idle workers. See Worker killing policy for how Ray considers idle workers for killing.
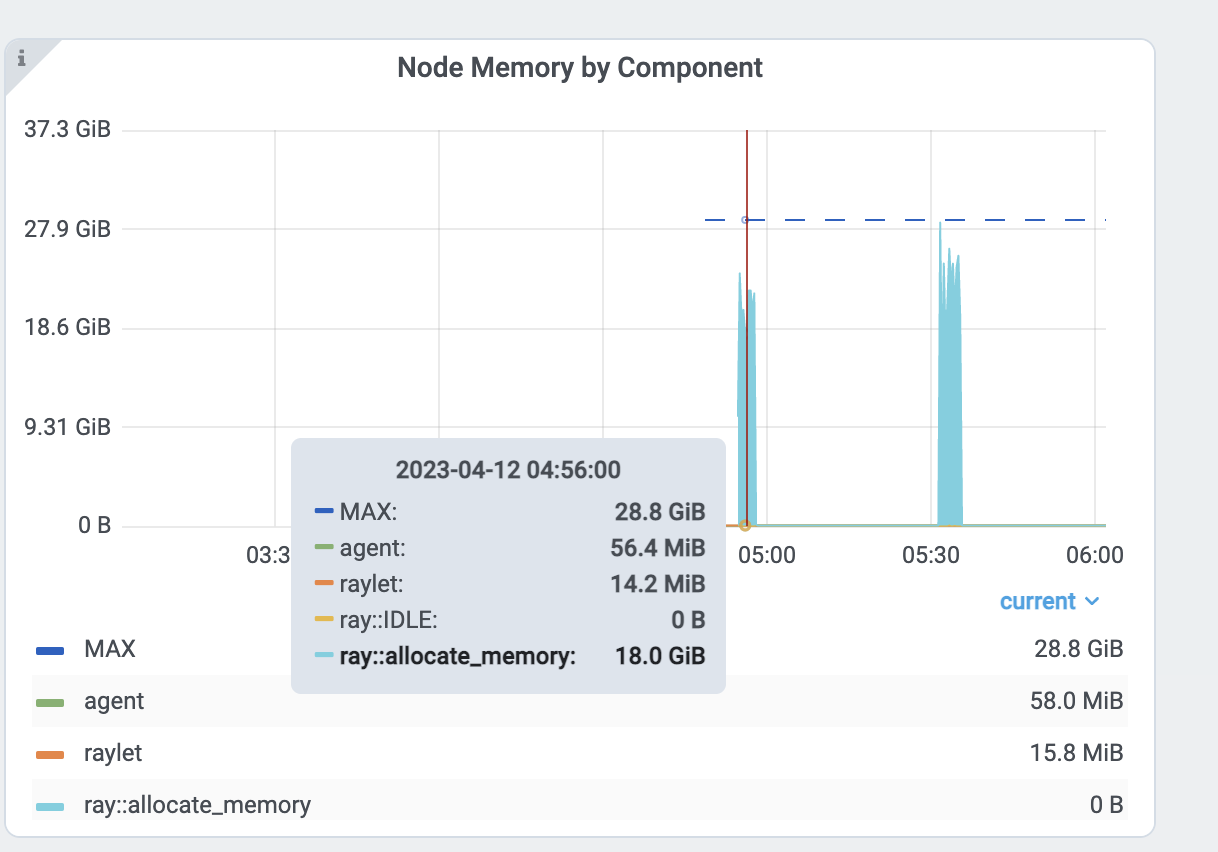
To view the memory usage of Tasks and Actors based on type over time, view the per Task and Actor memory usage graph for more details. The memory usage from the per component graph uses RSS - SHR. See below for reasoning.
Alternatively, you can also use the CLI command htop.
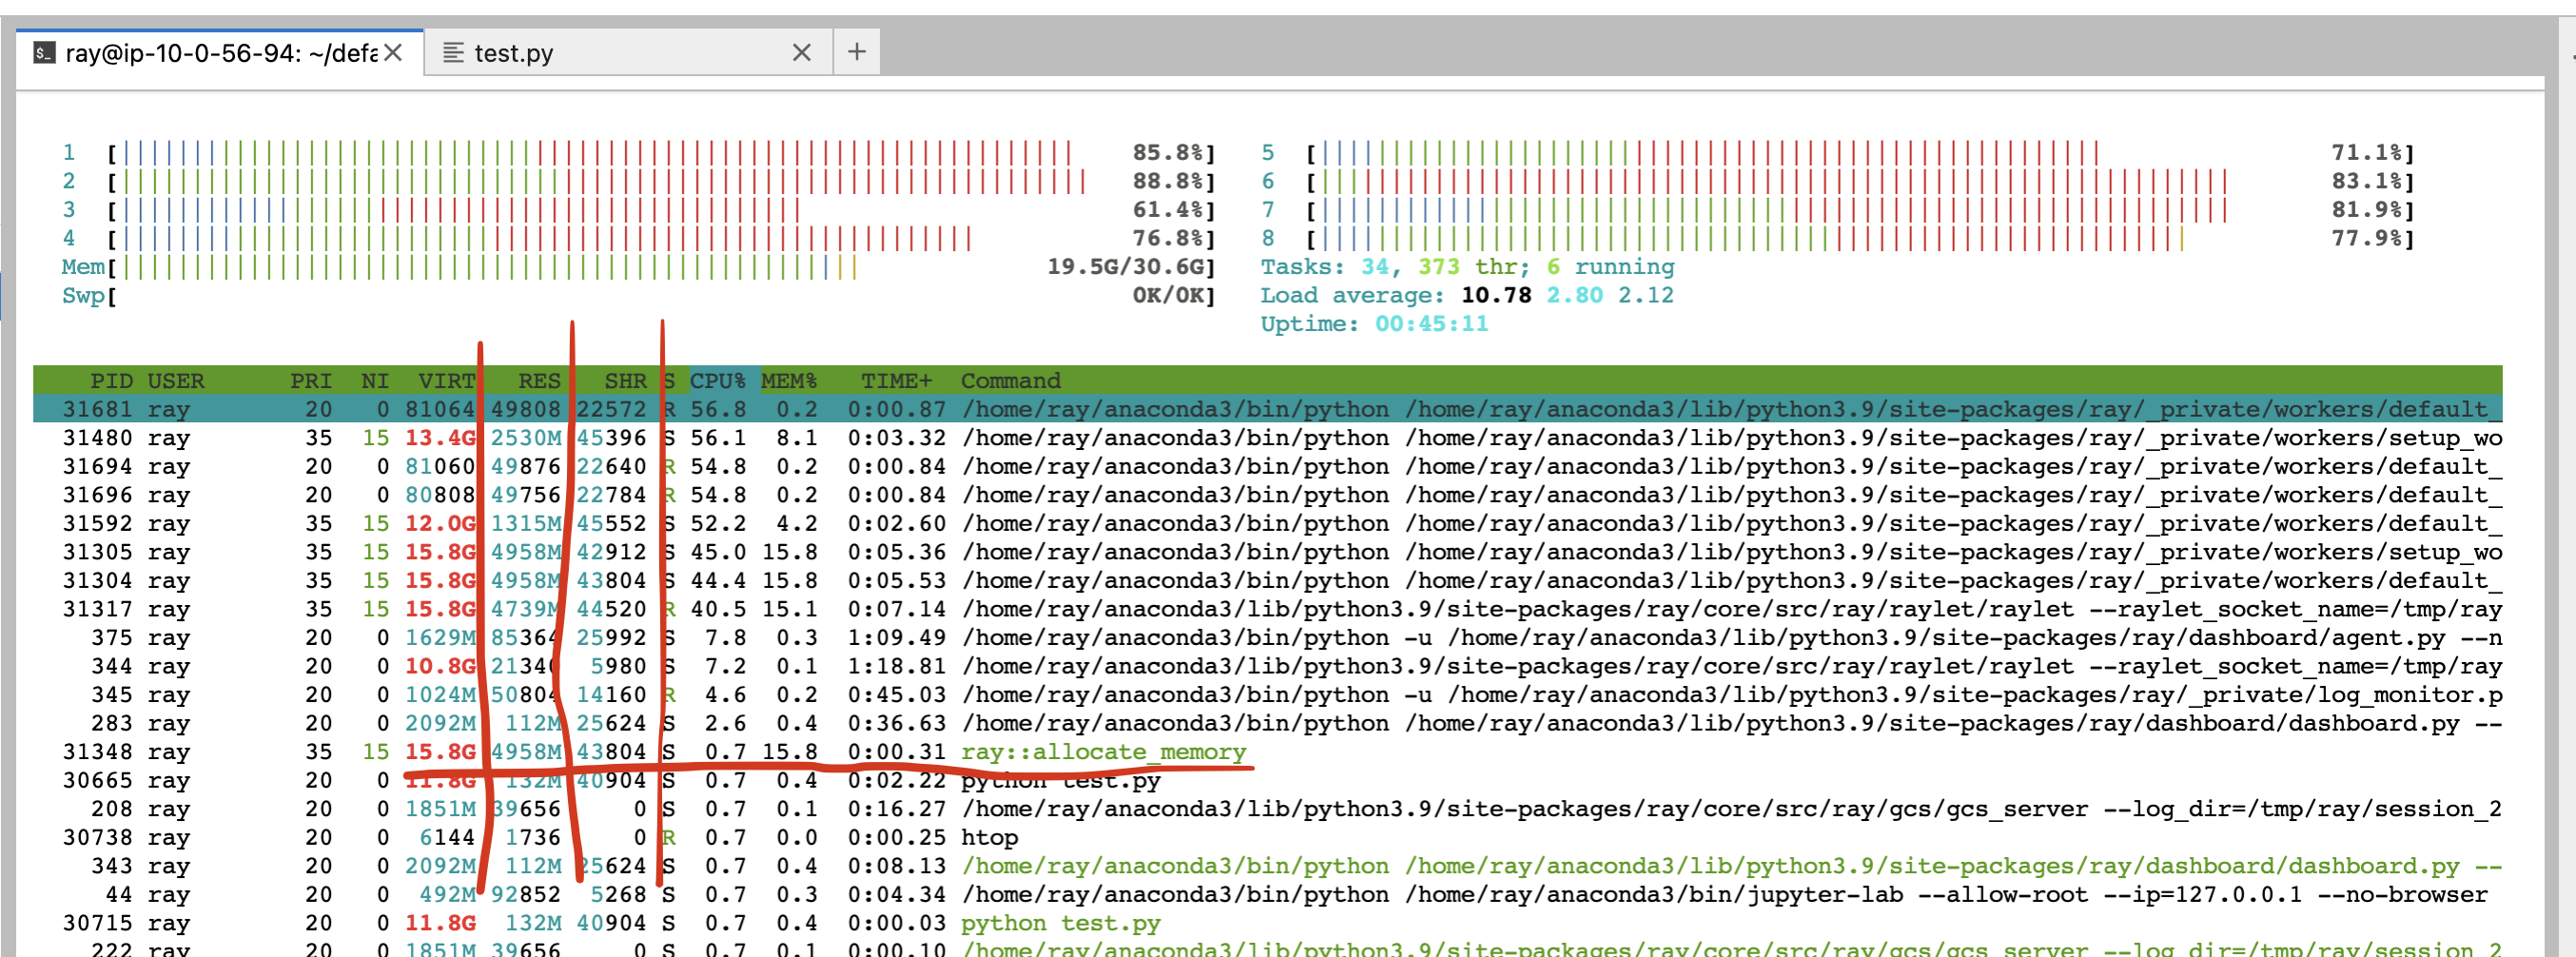
See the allocate_memory row. See two columns, RSS and SHR.
SHR usage is typically the memory usage from the Ray object store. The Ray object store allocates 30% of host memory to the shared memory (/dev/shm, unless you specify --object-store-memory).
If Ray workers access the object inside the object store using ray.get, SHR usage increases. Since the Ray object store supports the zero-copy
deserialization, several workers can access the same object without copying them to in-process memory. For example, if
8 workers access the same object inside the Ray object store, each process’ SHR usage increases. However, they are not using 8 * SHR memory (there’s only 1 copy in the shared memory).
Also note that Ray object store triggers object spilling when the object usage goes beyond the limit, which means the memory usage from the shared memory won’t exceed 30%
of the host memory.
Out-of-memory issues from a host, are due to RSS usage from each worker. Calculate per
process memory usage by RSS - SHR because SHR is for Ray object store as explained above. The total memory usage is typically
SHR (object store memory usage, 30% of memory) + sum(RSS - SHR from each ray proc) + sum(RSS - SHR from system components. e.g., raylet, GCS. Usually small).
Eliminating worker Out-Of-Memory errors#
Most out-of-memory errors come from oversubscribing memory on a node. By default, tasks and actors have no memory requirements, so the scheduler is unaware of their memory footprint and may schedule too many memory-hungry tasks or actors onto a single node.
To prevent this oversubscription and eliminate OOM issues, pass a memory resource request to tasks or actors
to reserve memory for them. See resource requirements for more details.
This request doesn’t impose any limit on memory usage; it’s used for scheduling only.
As shown in the example OOM log above, the log includes the resource request for each active worker. If the worker memory usage
exceeds the requested memory at the time of OOM, adjust the resource request accordingly.
Head node out-of-Memory error#
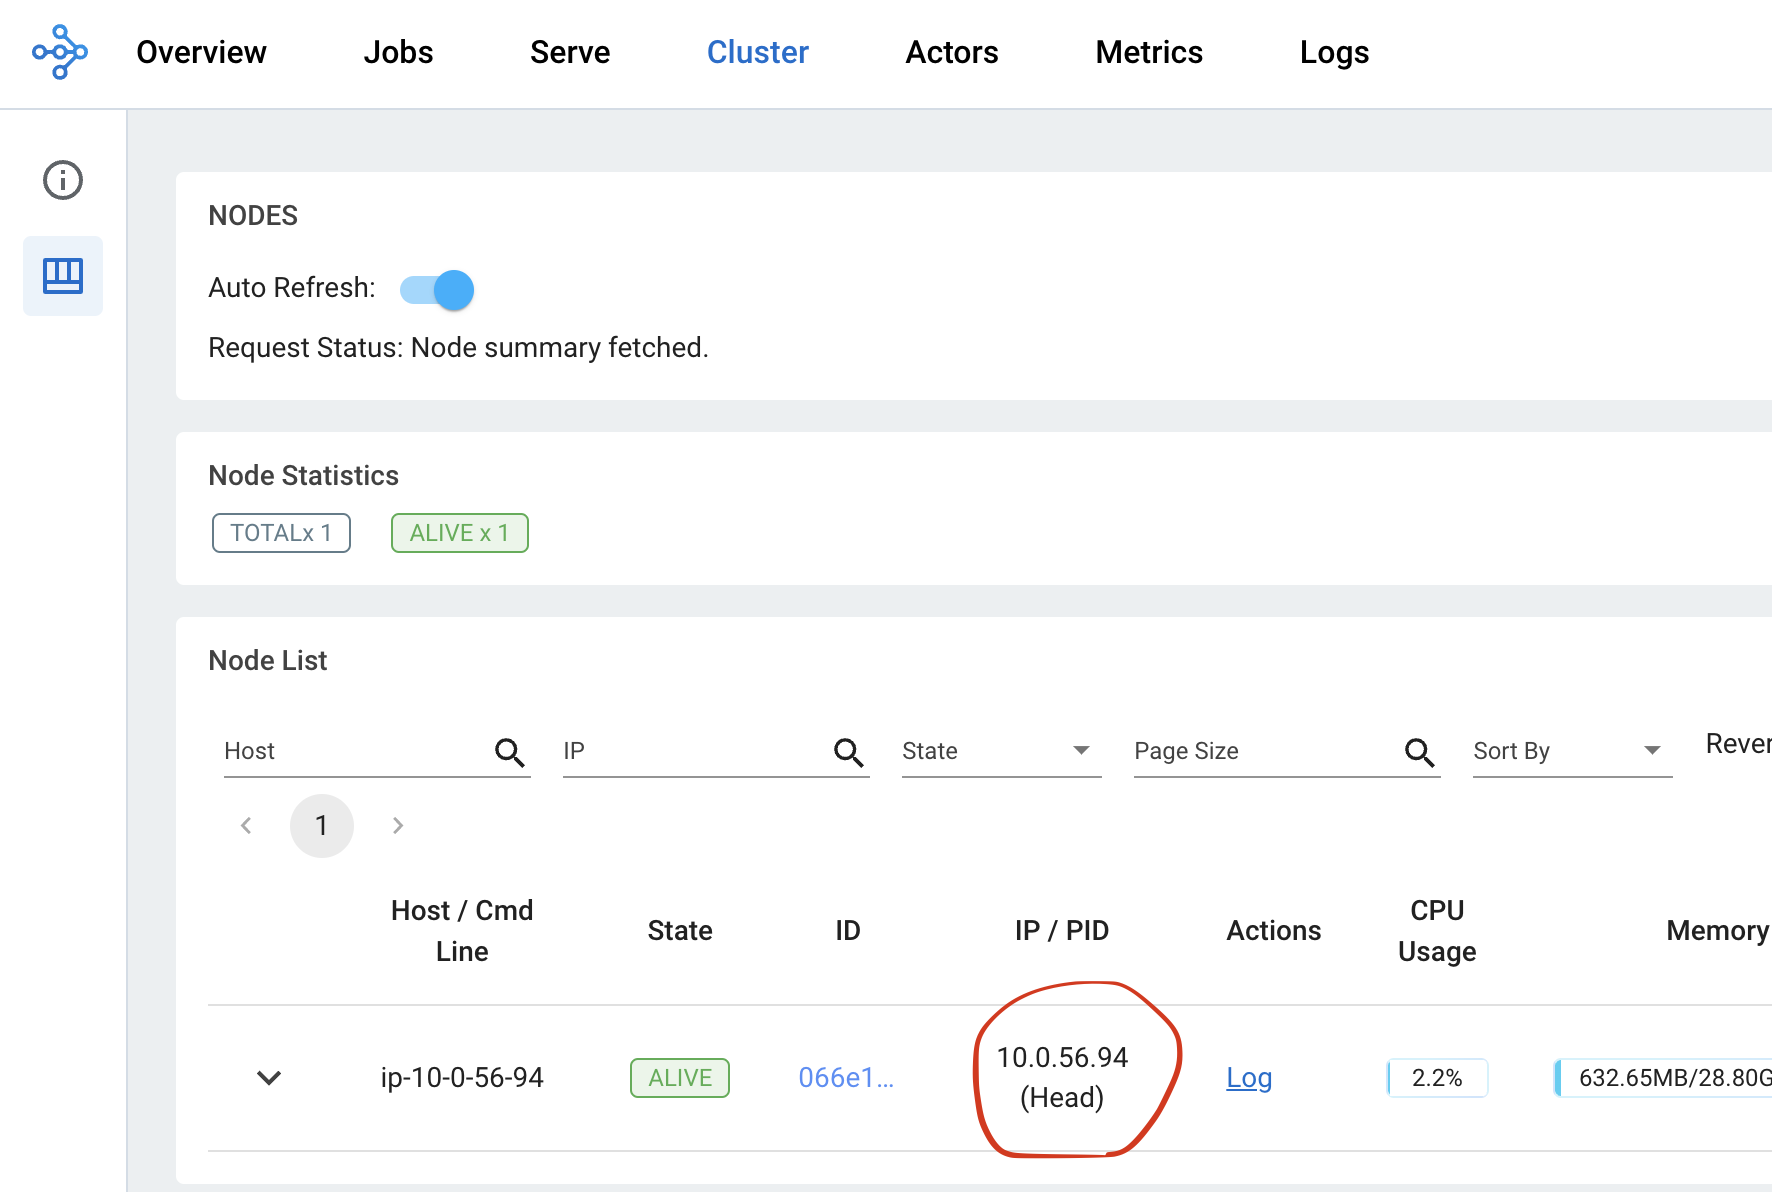
First, check the head node memory usage from the metrics page. Find the head node address from the cluster page.
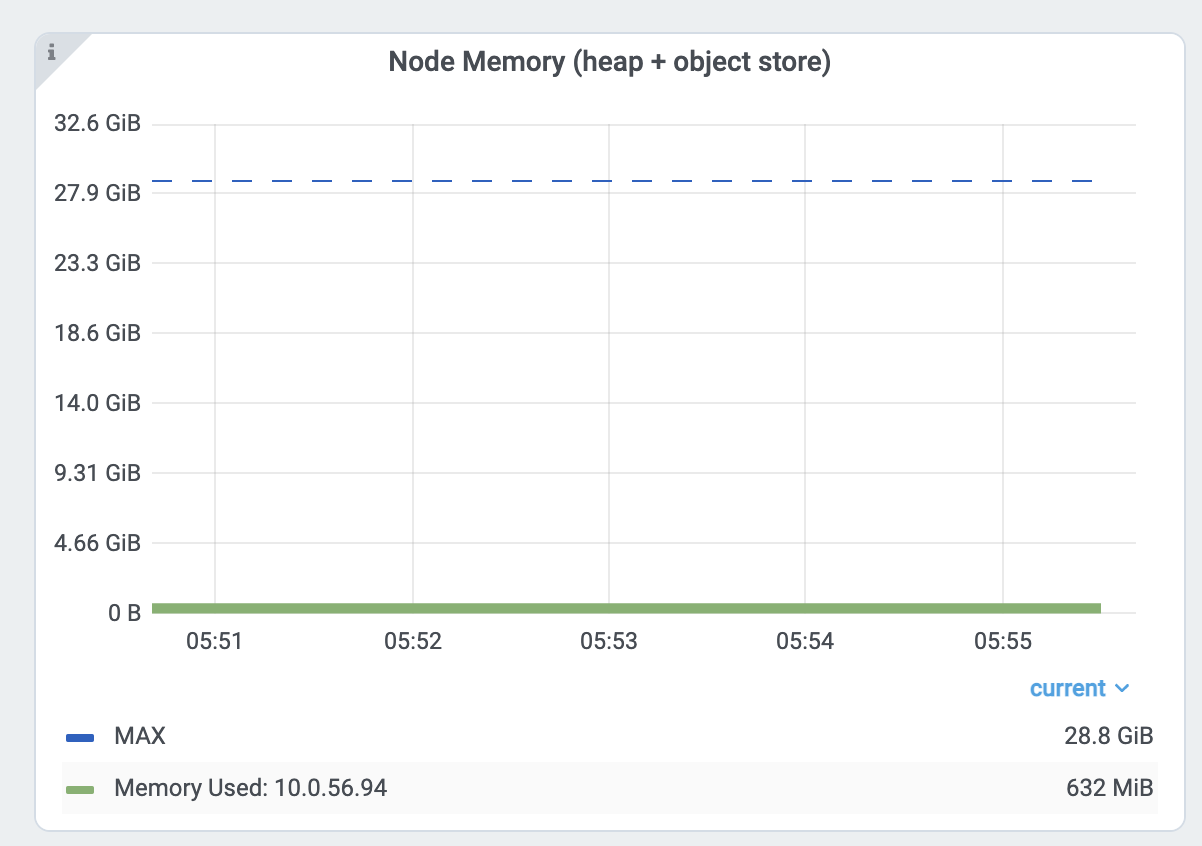
Then check the memory usage from the head node from the node memory usage view inside the Dashboard metrics view.
The Ray head node has more memory-demanding system components such as GCS or the dashboard.
Also, the driver runs from a head node by default. If the head node has the same memory capacity as worker nodes
and if you execute the same number of Tasks and Actors from a head node, it can easily have out-of-memory problems.
In this case, do not run any Tasks and Actors on the head node by specifying --num-cpus=0 when starting a head node by ray start --head.
If you use KubeRay, view here.
Reduce Parallelism#
High parallelism can trigger out-of-memory errors. For example, if
you have 8 training workers that perform the data preprocessing -> training.
If you load too much data into each worker, the total memory usage (training worker mem usage * 8) can exceed the
memory capacity.
Verify the memory usage by looking at the per Task and Actor memory usage graph and the Task metrics.
First, see the memory usage of an allocate_memory task. The total is 18GB.
At the same time, verify the 15 concurrent tasks that are running.
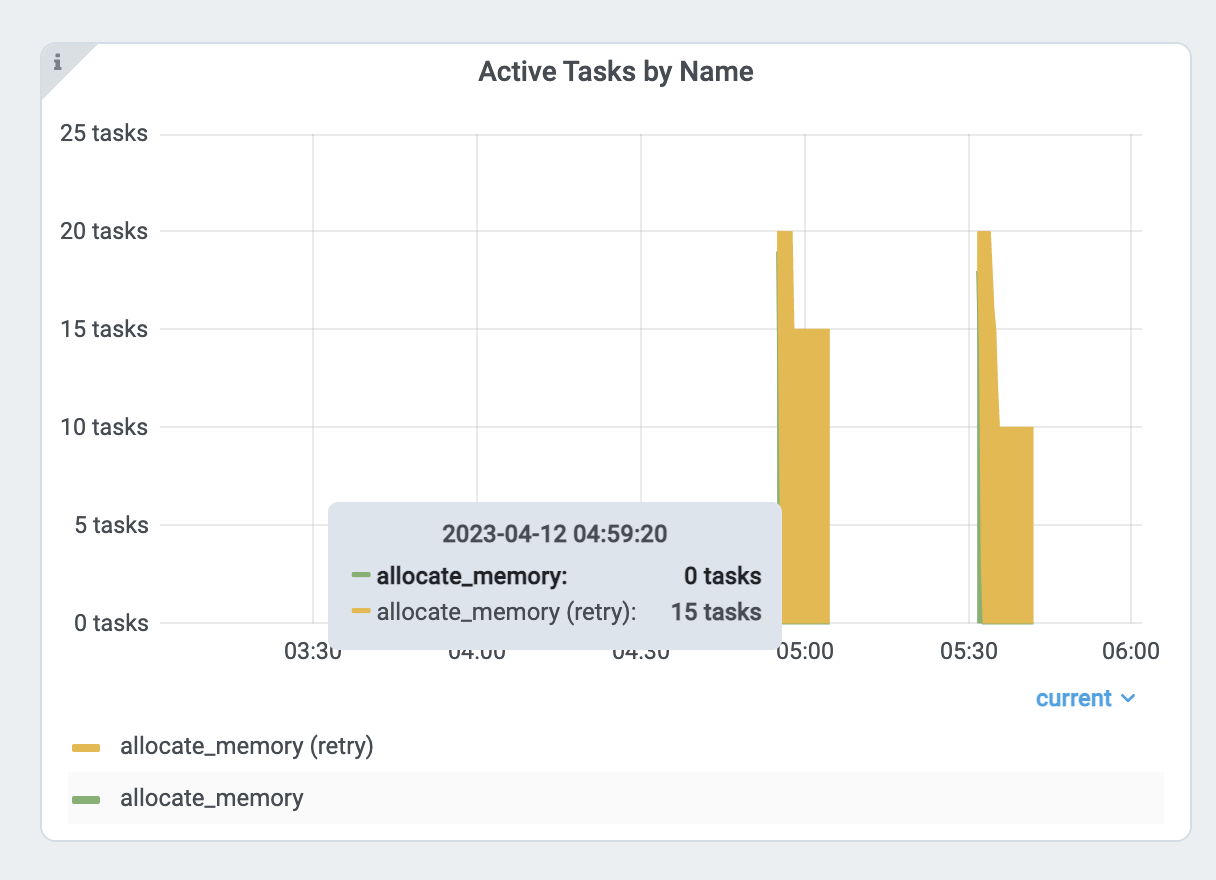
Each task uses about 18GB / 15 == 1.2 GB. To reduce the parallelism:
Increase the
num_cpusoptions forray.remote(). Modern hardware typically has 4GB of memory per CPU, so you can choose the CPU requirements accordingly. This example specifies 1 CPU perallocate_memoryTask. Doubling the CPU requirements, runs only half(7) of the Tasks at the same time, and memory usage doesn’t exceed 9GB.
Profiling Task and Actor memory usage#
It is also possible tasks and actors use more memory than you expect. For example, actors or tasks can have a memory leak or have unnecessary copies.
View the instructions below to learn how to memory profile individual actors and tasks.
Memory Profiling Ray tasks and actors#
To memory profile Ray tasks or actors, use memray. Note that you can also use other memory profiling tools if it supports a similar API.
First, install memray.
pip install memray
memray supports a Python context manager to enable memory profiling. You can write the memray profiling file wherever you want.
But in this example, we will write them to /tmp/ray/session_latest/logs because Ray dashboard allows you to download files inside the log folder.
This will allow you to download profiling files from other nodes.
import memray
import ray


@ray.remote
class Actor:
    def __init__(self):
        # Every memory allocation after `__enter__` method will be tracked.
        memray.Tracker(
            "/tmp/ray/session_latest/logs/"
            f"{ray.get_runtime_context().get_actor_id()}_mem_profile.bin"
        ).__enter__()
        self.arr = [bytearray(b"1" * 1000000)]

    def append(self):
        self.arr.append(bytearray(b"1" * 1000000))


a = Actor.remote()
ray.get(a.append.remote())
Note that tasks have a shorter lifetime, so there could be lots of memory profiling files.
import memray  # noqa
import ray  # noqa


@ray.remote
def task():
    with memray.Tracker(
        "/tmp/ray/session_latest/logs/"
        f"{ray.get_runtime_context().get_task_id()}_mem_profile.bin"
    ):
        arr = bytearray(b"1" * 1000000)  # noqa


ray.get(task.remote())
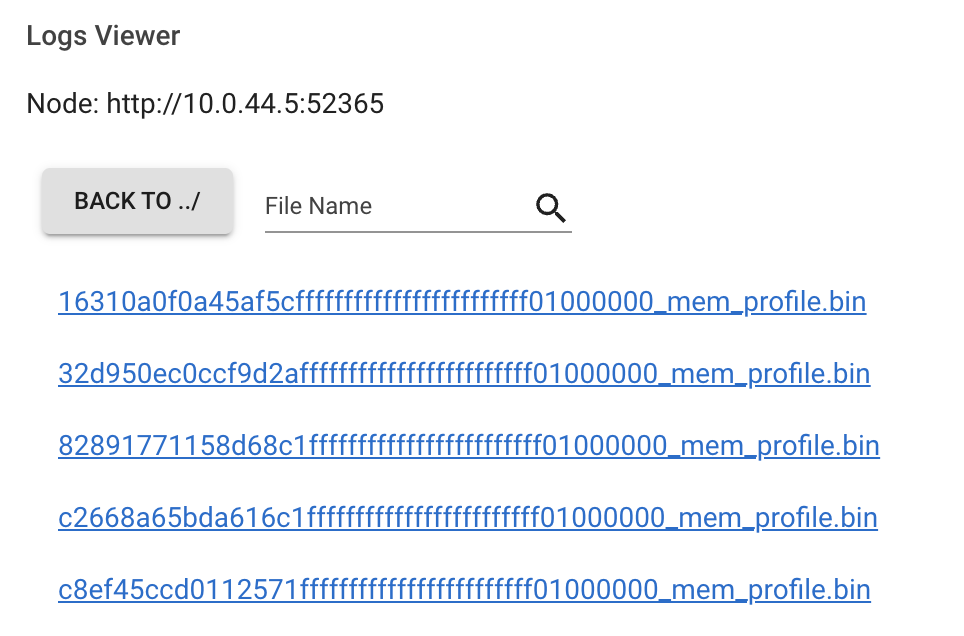
Once the task or actor runs, go to the Logs view of the dashboard. Find and click the log file name.
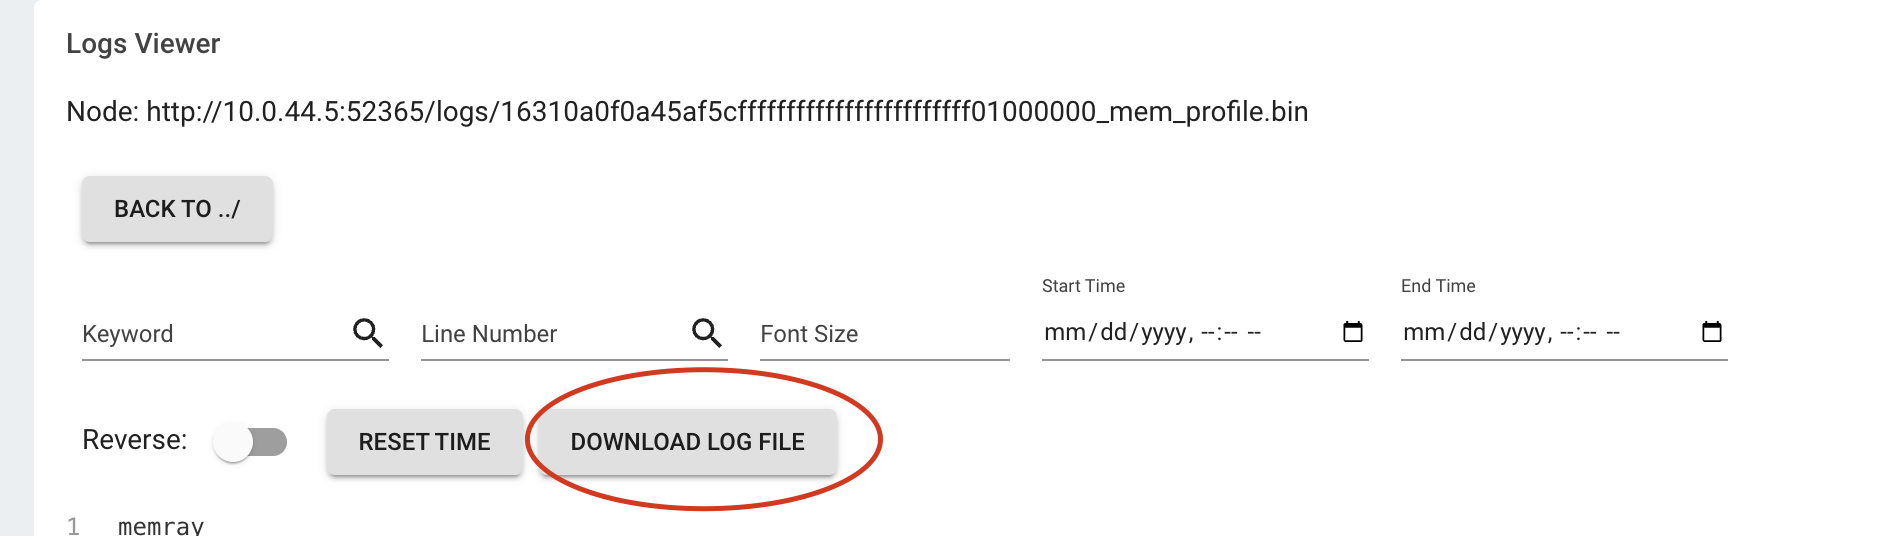
Click the download button.
Now, you have the memory profiling file. Running
memray flamegraph <memory profiling bin file>
And you can see the result of the memory profiling!