Profiling#
Ray Compiled Graph provides both PyTorch-based and Nsight-based profiling functionalities to better understand the performance of individual tasks, system overhead, and performance bottlenecks. You can pick your favorite profiler based on your preference.
PyTorch profiler#
To run PyTorch Profiling on Compiled Graph, simply set the environment variable RAY_CGRAPH_ENABLE_TORCH_PROFILING=1
when running the script. For example, for a Compiled Graph script in example.py, run the following command:
RAY_CGRAPH_ENABLE_TORCH_PROFILING=1 python3 example.py
After execution, Compiled Graph generates the profiling results in the compiled_graph_torch_profiles directory
under the current working directory. Compiled Graph generates one trace file per actor.
You can visualize traces by using https://ui.perfetto.dev/.
Nsight system profiler#
Compiled Graph builds on top of Ray’s profiling capabilities, and leverages Nsight system profiling.
To run Nsight Profiling on Compiled Graph, specify the runtime_env for the involved actors as described in Run Nsight on Ray. For example,
import ray
import torch
from ray.dag import InputNode


@ray.remote(num_gpus=1, runtime_env={"nsight": "default"})
class RayActor:
    def send(self, shape, dtype, value: int):
        return torch.ones(shape, dtype=dtype, device="cuda") * value

    def recv(self, tensor):
        return (tensor[0].item(), tensor.shape, tensor.dtype)


sender = RayActor.remote()
receiver = RayActor.remote()
Then, create a Compiled Graph as usual.
shape = (10,)
dtype = torch.float16

# Test normal execution.
with InputNode() as inp:
    dag = sender.send.bind(inp.shape, inp.dtype, inp[0])
    dag = dag.with_tensor_transport(transport="nccl")
    dag = receiver.recv.bind(dag)

compiled_dag = dag.experimental_compile()

for i in range(3):
    shape = (10 * (i + 1),)
    ref = compiled_dag.execute(i, shape=shape, dtype=dtype)
    assert ray.get(ref) == (i, shape, dtype)
Finally, run the script as usual.
python3 example.py
After execution, Compiled Graph generates the profiling results under the /tmp/ray/session_*/logs/{profiler_name}
directory.
For fine-grained performance analysis of method calls and system overhead, set the environment variable
RAY_CGRAPH_ENABLE_NVTX_PROFILING=1 when running the script:
RAY_CGRAPH_ENABLE_NVTX_PROFILING=1 python3 example.py
This command leverages the NVTX library under the hood to automatically annotate all methods called in the execution loops of compiled graph.
To visualize the profiling results, follow the same instructions as described in Nsight Profiling Result.
Visualization#
To visualize the graph structure, call the visualize method after calling experimental_compile
on the graph.
import ray
from ray.dag import InputNode, MultiOutputNode


@ray.remote
class Worker:
    def inc(self, x):
        return x + 1

    def double(self, x):
        return x * 2

    def echo(self, x):
        return x


sender1 = Worker.remote()
sender2 = Worker.remote()
receiver = Worker.remote()

with InputNode() as inp:
    w1 = sender1.inc.bind(inp)
    w1 = receiver.echo.bind(w1)
    w2 = sender2.double.bind(inp)
    w2 = receiver.echo.bind(w2)
    dag = MultiOutputNode([w1, w2])

compiled_dag = dag.experimental_compile()
compiled_dag.visualize()
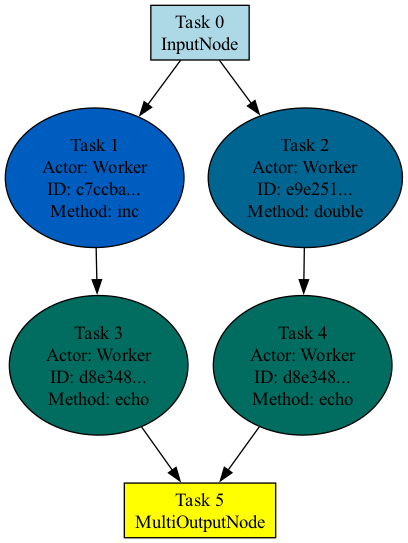
By default, Ray generates a PNG image named compiled_graph.png and saves it in the current working directory.
Note that this requires graphviz.
The following image shows the visualization for the preceding code. Tasks that belong to the same actor are the same color.