Profiling with py-spy#
Stack trace and CPU profiling#
py-spy is a sampling profiler for Python programs. It lets you visualize what your Python program is spending time on without restarting the program or modifying the code in any way. This section describes how to configure RayCluster YAML file to enable py-spy and see Stack Trace and CPU Flame Graph on Ray Dashboard.
Prerequisite#
py-spy requires the SYS_PTRACE capability to read process memory. However, Kubernetes omits this capability by default. To enable profiling, add the following to the template.spec.containers for both the head and worker Pods.
securityContext:
  capabilities:
    add:
    - SYS_PTRACE
Notes:
The
baselineandrestrictedPod Security Standards forbid addingSYS_PTRACE. See Pod Security Standards for more details.
Check CPU flame graph and stack trace on Ray Dashboard#
Step 1: Create a Kind cluster#
kind create cluster
Step 2: Install the KubeRay operator#
Follow this document to install the latest stable KubeRay operator using Helm repository.
Step 3: Create a RayCluster with SYS_PTRACE capability#
kubectl apply -f https://raw.githubusercontent.com/ray-project/kuberay/master/ray-operator/config/samples/ray-cluster.py-spy.yaml
Step 4: Forward the dashboard port#
kubectl port-forward svc/raycluster-py-spy-head-svc 8265:8265
Step 5: Run a sample job within the head Pod#
# Log in to the head Pod
kubectl exec -it ${YOUR_HEAD_POD} -- bash

# (Head Pod) Run a sample job in the Pod
# `long_running_task` includes a `while True` loop to ensure the task remains actively running indefinitely.
# This allows you ample time to view the Stack Trace and CPU Flame Graph via Ray Dashboard.
python3 samples/long_running_task.py
Notes:
If you’re running your own examples and encounter the error
Failed to write flamegraph: I/O error: No stack counts foundwhen viewing CPU Flame Graph, it might be due to the process being idle. Notably, using thesleepfunction can lead to this state. In such situations, py-spy filters out the idle stack traces. Refer to this issue for more information.
Step 6: Profile using Ray Dashboard#
Visit http://localhost:8265/#/cluster.
Click
Stack Traceforray::long_running_task.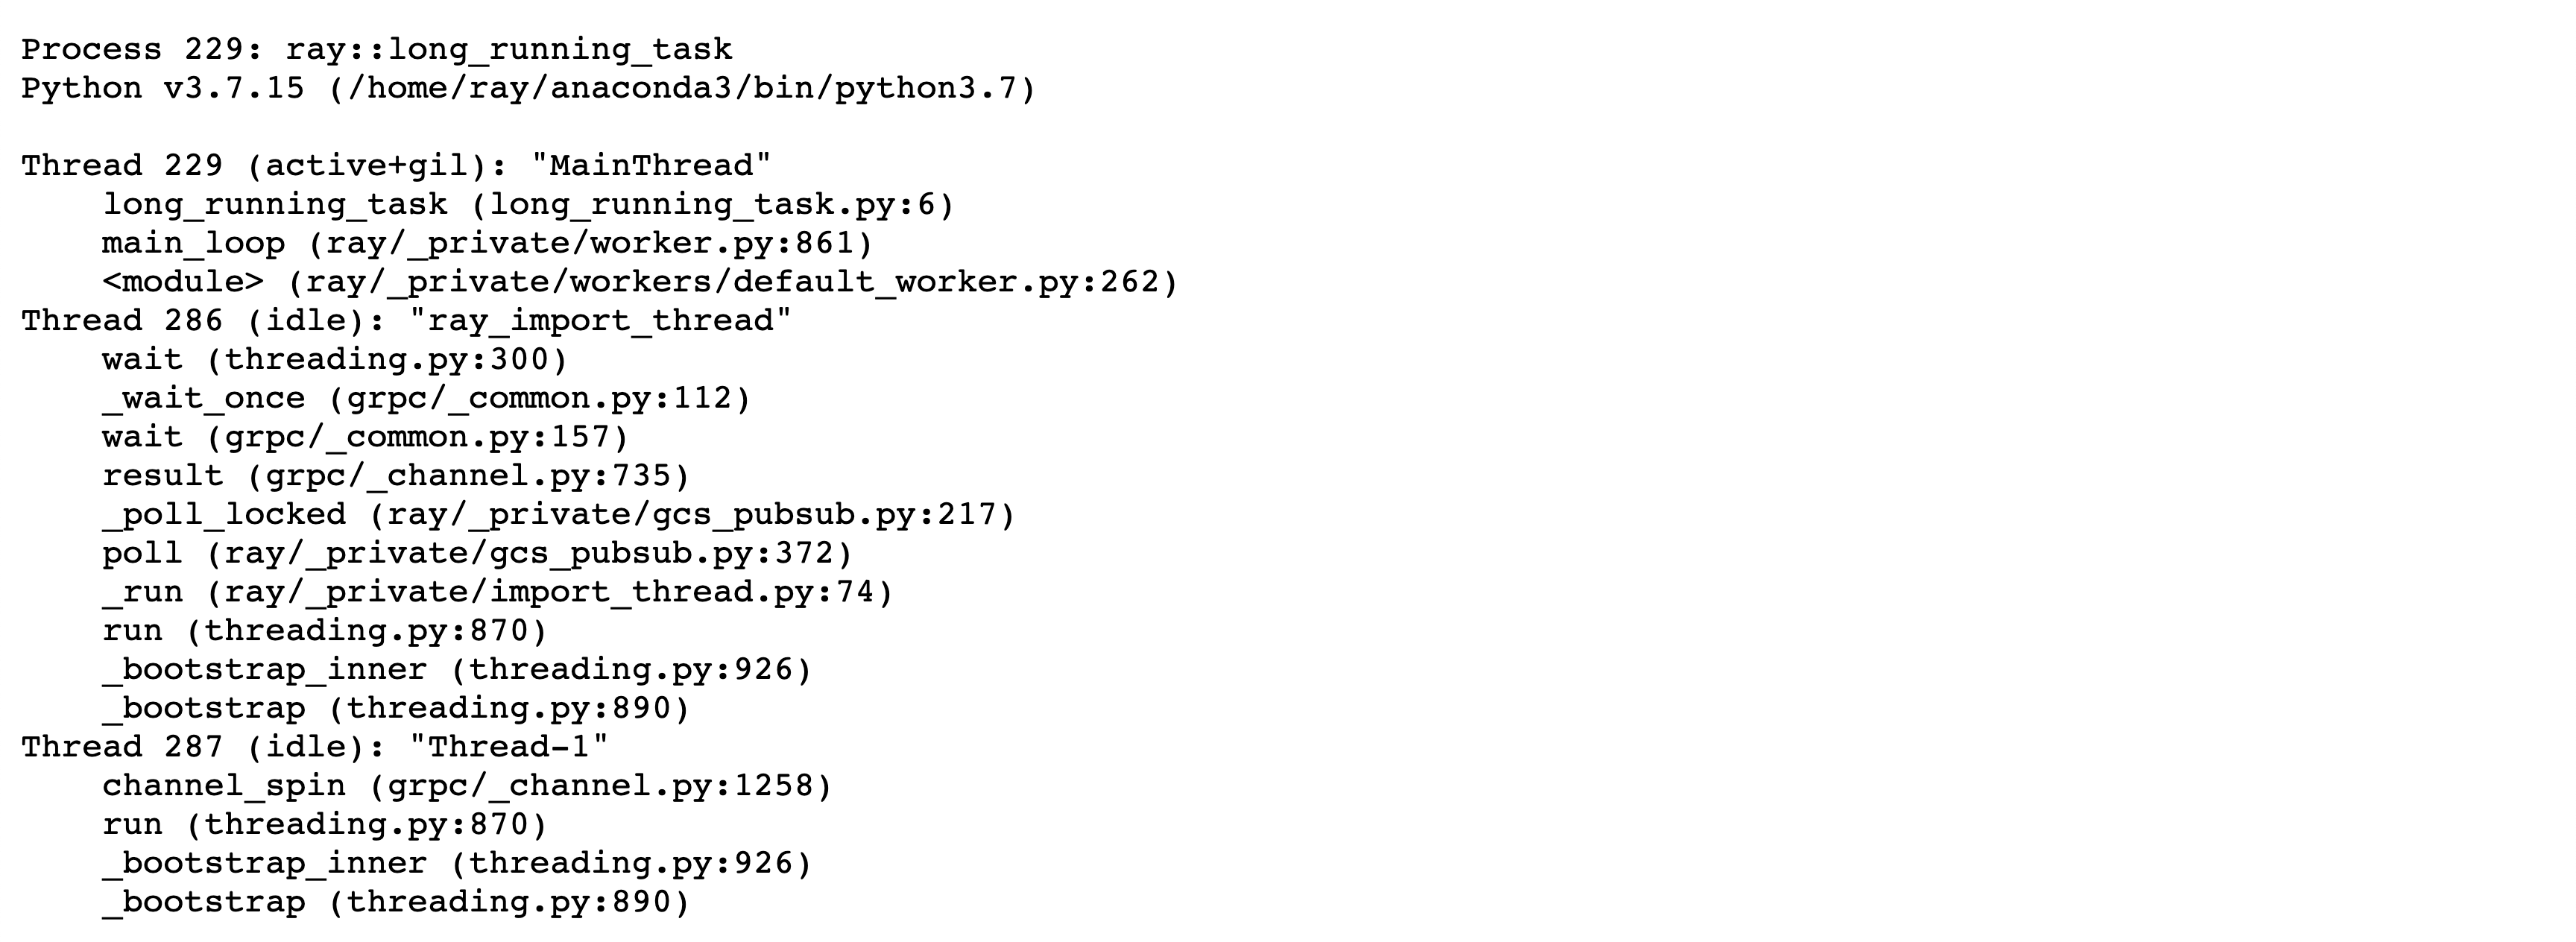
Click
CPU Flame Graphforray::long_running_task.
For additional details on using the profiler, See Python CPU profiling in the Dashboard.
Step 7: Clean up#
kubectl delete -f https://raw.githubusercontent.com/ray-project/kuberay/master/ray-operator/config/samples/ray-cluster.py-spy.yaml
helm uninstall kuberay-operator