Observability and monitoring#
Monitor your LLM deployments with built-in metrics, dashboards, and logging.
Ray Serve LLM includes the following observability features:
Service-level metrics: Request and token behavior across deployed models.
Engine metrics: vLLM-specific performance metrics such as TTFT and TPOT.
Grafana dashboards: Pre-built dashboard for LLM-specific visualizations.
Prometheus integration: Export capability for all metrics for custom monitoring and alerting.
Service-level metrics#
Ray enables LLM service-level logging by default, making these statistics available through Grafana and Prometheus. For more details on configuring Grafana and Prometheus, see Collecting and monitoring metrics.
These higher-level metrics track request and token behavior across deployed models:
Average total tokens per request
Ratio of input tokens to generated tokens
Peak tokens per second
Request latency and throughput
Model-specific request counts
Grafana dashboard#
Ray includes a Serve LLM-specific dashboard, which is automatically available in Grafana:
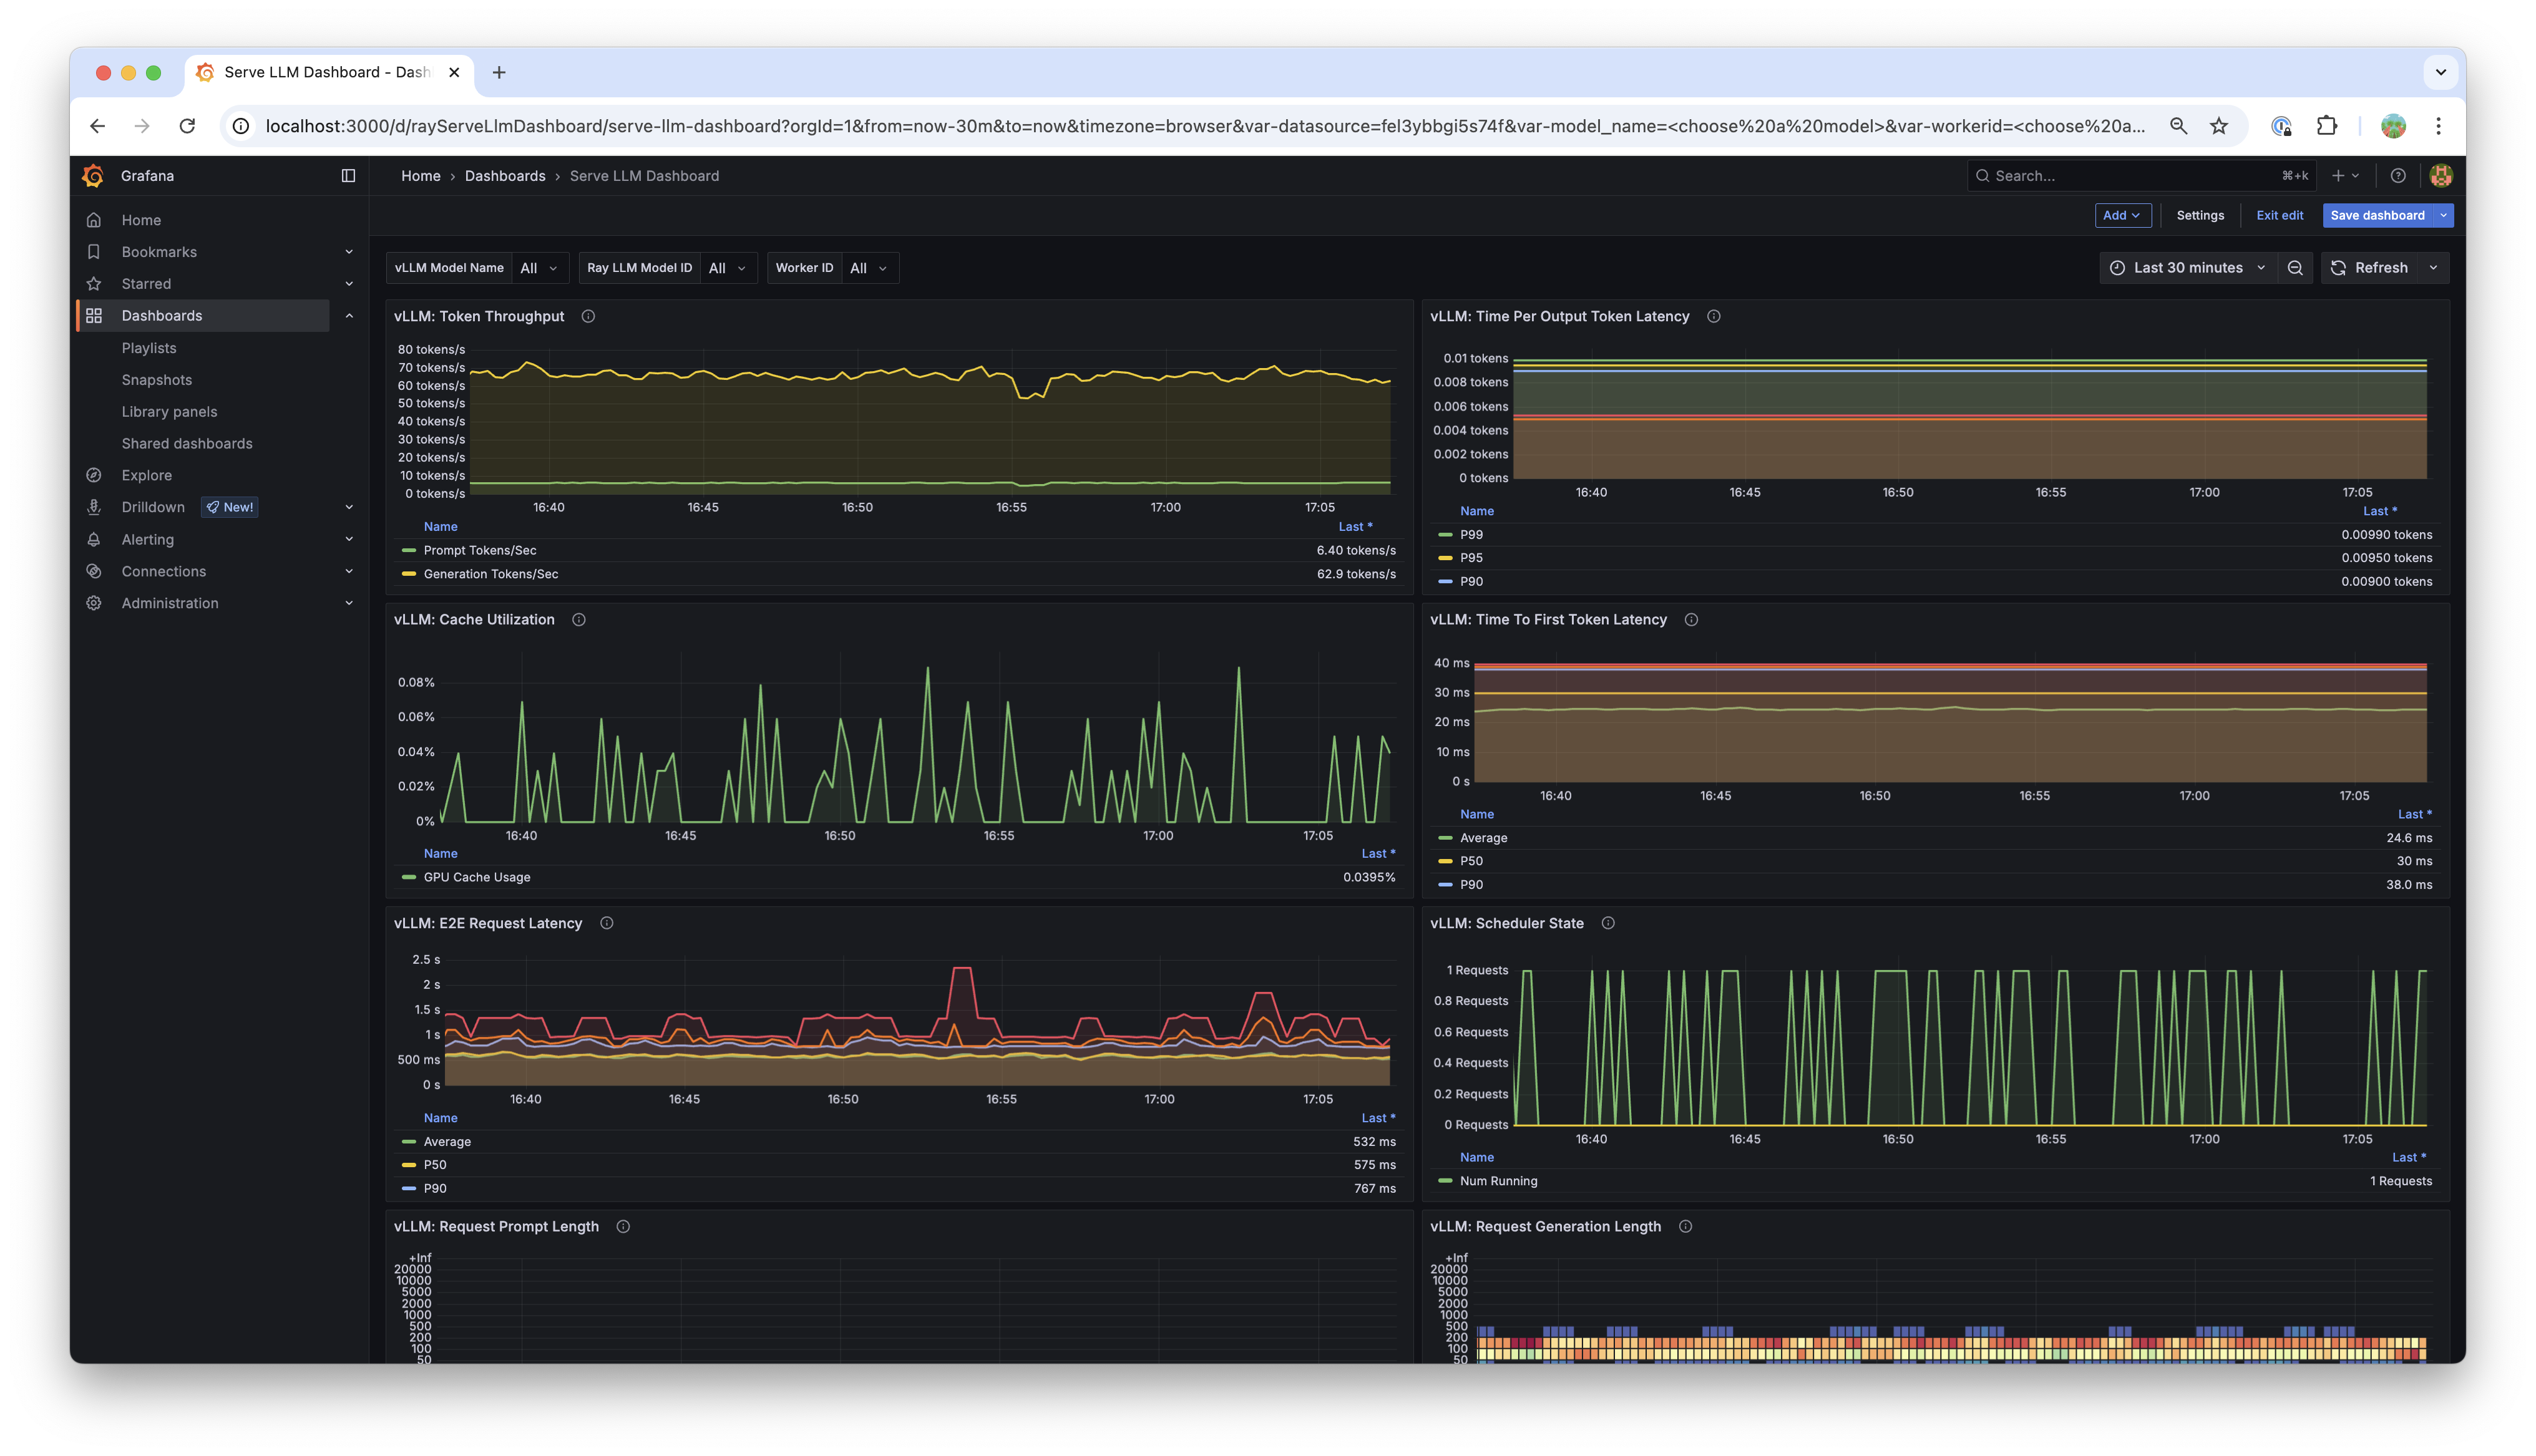
The dashboard includes visualizations for:
Request metrics: Throughput, latency, and error rates.
Token metrics: Input/output token counts and ratios.
Performance metrics: Time to first token (TTFT), time per output token (TPOT).
Resource metrics: GPU cache utilization, memory usage.
Engine metrics#
All engine metrics, including vLLM, are available through the Ray metrics export endpoint and are queryable with Prometheus. See vLLM metrics for a complete list. The Serve LLM Grafana dashboard also visualizes these metrics.
Key engine metrics include:
Time to first token (TTFT): Latency before the first token is generated.
Time per output token (TPOT): Average latency per generated token.
GPU cache utilization: KV cache memory usage.
Batch size: Current and average batch sizes.
Throughput: Requests per second and tokens per second.
Configure engine metrics#
Engine metric logging is on by default as of Ray 2.51. To disable engine-level metric logging, set log_engine_metrics: False when configuring the LLM deployment:
from ray import serve
from ray.serve.llm import LLMConfig, build_openai_app

llm_config = LLMConfig(
    model_loading_config=dict(
        model_id="qwen-0.5b",
        model_source="Qwen/Qwen2.5-0.5B-Instruct",
    ),
    deployment_config=dict(
        autoscaling_config=dict(
            min_replicas=1, max_replicas=2,
        )
    ),
    log_engine_metrics=False  # Disable engine metrics
)

app = build_openai_app({"llm_configs": [llm_config]})
serve.run(app, blocking=True)
# config.yaml
applications:
- args:
    llm_configs:
        - model_loading_config:
            model_id: qwen-0.5b
            model_source: Qwen/Qwen2.5-0.5B-Instruct
        accelerator_type: A10G
        deployment_config:
            autoscaling_config:
                min_replicas: 1
                max_replicas: 2
        log_engine_metrics: false  # Disable engine metrics
  import_path: ray.serve.llm:build_openai_app
  name: llm_app
  route_prefix: "/"
Usage data collection#
The Ray Team collects usage data to improve Ray Serve LLM. The team collects data about the following features and attributes:
Model architecture used for serving.
Whether JSON mode is used.
Whether LoRA is used and how many LoRA weights are loaded initially at deployment time.
Whether autoscaling is used and the min and max replicas setup.
Tensor parallel size used.
Initial replicas count.
GPU type used and number of GPUs used.
To opt out from usage data collection, see Ray usage stats for how to disable it.
See also#
Collecting and monitoring metrics - Ray metrics collection guide
Troubleshooting - Common issues and solutions