Using Prometheus and Grafana#
This section will describe how to monitor Ray Clusters in Kubernetes using Prometheus & Grafana.
If you do not have any experience with Prometheus and Grafana on Kubernetes, watch this YouTube playlist.
Preparation#
Clone the KubeRay repository and checkout the master branch. This tutorial requires several files in the repository.
Step 1: Create a Kubernetes cluster with Kind#
kind create cluster
Step 2: Install Kubernetes Prometheus Stack via Helm chart#
# Path: kuberay/
./install/prometheus/install.sh --auto-load-dashboard true

# Check the installation
kubectl get all -n prometheus-system

# (part of the output)
# NAME                                                  READY   UP-TO-DATE   AVAILABLE   AGE
# deployment.apps/prometheus-grafana                    1/1     1            1           46s
# deployment.apps/prometheus-kube-prometheus-operator   1/1     1            1           46s
# deployment.apps/prometheus-kube-state-metrics         1/1     1            1           46s
KubeRay provides an install.sh script to:
Install the kube-prometheus-stack v48.2.1 chart and related custom resources, including PodMonitor for Ray Pods and PrometheusRule, in the namespace
prometheus-systemautomatically.Import Ray Dashboard’s Grafana JSON files into Grafana using the
--auto-load-dashboard trueflag. If the flag isn’t set, the following step also provides instructions for manual import. See Step 12: Import Grafana dashboards manually (optional) for more details.
We made some modifications to the original
values.yamlin kube-prometheus-stack chart to allow embedding Grafana panels in Ray Dashboard. See overrides.yaml for more details.grafana: grafana.ini: security: allow_embedding: true auth.anonymous: enabled: true org_role: Viewer
Step 3: Install a KubeRay operator#
Follow this document to install the latest stable KubeRay operator via Helm repository.
Set
metrics.serviceMonitor.enabled=truewhen installing the KubeRay operator with Helm to create a ServiceMonitor that scrapes metrics exposed by the KubeRay operator’s service.# Enable the ServiceMonitor and set the label `release: prometheus` to the ServiceMonitor so that Prometheus can discover it helm install kuberay-operator kuberay/kuberay-operator --version 1.6.0 \ --set metrics.serviceMonitor.enabled=true \ --set metrics.serviceMonitor.selector.release=prometheus
You can verify the ServiceMonitor creation with:
kubectl get servicemonitor
# NAME               AGE
# kuberay-operator   11s
Step 4: Install a RayCluster#
# path: ray-operator/config/samples/
kubectl apply -f ray-cluster.embed-grafana.yaml

# Check there's a Service that specifies port 8080 for the metrics endpoint.
# There may be a slight delay between RayCluster and Service creation.
kubectl get service -l ray.io/cluster=raycluster-embed-grafana

# NAME                                TYPE        CLUSTER-IP      EXTERNAL-IP   PORT(S)                                                    AGE
# raycluster-embed-grafana-head-svc   ClusterIP   None            <none>        44217/TCP,10001/TCP,44227/TCP,8265/TCP,6379/TCP,8080/TCP   13m

# Wait until all Ray Pods are ready.
kubectl wait pods -l ray.io/cluster=raycluster-embed-grafana --timeout 2m --for condition=Ready

# pod/raycluster-embed-grafana-head-2jk7c condition met
# pod/raycluster-embed-grafana-small-group-worker-8g2vv condition met

# Forward the port of the Prometheus metrics endpoint.
kubectl port-forward service/raycluster-embed-grafana-head-svc metrics

# Check metrics in a new terminal.
curl localhost:8080

# Example output (Prometheus metrics format):
# # HELP ray_spill_manager_request_total Number of {spill, restore} requests.
# # TYPE ray_spill_manager_request_total gauge
# ray_spill_manager_request_total{Component="raylet", NodeAddress="10.244.0.13", SessionName="session_2025-01-02_07-58-21_419367_11", Type="FailedDeletion", Version="2.9.0", container="ray-head", endpoint="metrics", instance="10.244.0.13:8080", job="prometheus-system/ray-head-monitor", namespace="default", pod="raycluster-embed-grafana-head-98fqt", ray_io_cluster="raycluster-embed-grafana"} 0
KubeRay exposes a Prometheus metrics endpoint in port 8080 via a built-in exporter by default. Hence, we do not need to install any external exporter.
If you want to configure the metrics endpoint to a different port, see kuberay/#954 for more details.
Prometheus metrics format:
# HELP: Describe the meaning of this metric.# TYPE: See this document for more details.
Three required environment variables are defined in ray-cluster.embed-grafana.yaml. See Configuring and Managing Ray Dashboard for more details about these environment variables.
env:
  - name: RAY_GRAFANA_IFRAME_HOST
    value: http://127.0.0.1:3000
  - name: RAY_GRAFANA_HOST
    value: http://prometheus-grafana.prometheus-system.svc:80
  - name: RAY_PROMETHEUS_HOST
    value: http://prometheus-kube-prometheus-prometheus.prometheus-system.svc:9090
Note that we do not deploy Grafana in the head Pod, so we need to set both
RAY_GRAFANA_IFRAME_HOSTandRAY_GRAFANA_HOST.RAY_GRAFANA_HOSTis used by the head Pod to send health-check requests to Grafana in the backend.RAY_GRAFANA_IFRAME_HOSTis used by your browser to fetch the Grafana panels from the Grafana server rather than from the head Pod. Because we forward the port of Grafana to127.0.0.1:3000in this example, we setRAY_GRAFANA_IFRAME_HOSTtohttp://127.0.0.1:3000.http://is required.
Step 5: Collect Head Node metrics with a PodMonitor#
RayService creates two Kubernetes services for the head Pod; one managed by the RayService and the other by the underlying RayCluster. Therefore, it’s recommended to use a PodMonitor to monitor the metrics for head Pods to avoid misconfigurations that could result in double counting the same metrics when using a ServiceMonitor.
apiVersion: monitoring.coreos.com/v1
kind: PodMonitor
metadata:
  labels:
    # `release: $HELM_RELEASE`: Prometheus can only detect PodMonitor with this label.
    release: prometheus
  name: ray-head-monitor
  namespace: prometheus-system
spec:
  jobLabel: ray-head
  # Only select Kubernetes Pods in the "default" namespace.
  namespaceSelector:
    matchNames:
      - default
  # Only select Kubernetes Pods with "matchLabels".
  selector:
    matchLabels:
      ray.io/node-type: head
  # A list of endpoints allowed as part of this PodMonitor.
  podMetricsEndpoints:
    - port: metrics
      relabelings:
        - action: replace
          sourceLabels:
            - __meta_kubernetes_pod_label_ray_io_cluster
          targetLabel: ray_io_cluster
    - port: as-metrics # autoscaler metrics
      relabelings:
        - action: replace
          sourceLabels:
            - __meta_kubernetes_pod_label_ray_io_cluster
          targetLabel: ray_io_cluster
    - port: dash-metrics # dashboard metrics
      relabelings:
        - action: replace
          sourceLabels:
            - __meta_kubernetes_pod_label_ray_io_cluster
          targetLabel: ray_io_cluster
The install.sh script creates the above YAML example, podMonitor.yaml so you don’t need to create anything.
See the official PodMonitor doc for more details about configurations.
release: $HELM_RELEASE: Prometheus can only detect PodMonitor with this label. See here for more details.
helm ls -n prometheus-system
# ($HELM_RELEASE is "prometheus".)
# NAME            NAMESPACE               REVISION        UPDATED                                 STATUS          CHART                           APP VERSION
# prometheus      prometheus-system       1               2023-02-06 06:27:05.530950815 +0000 UTC deployed        kube-prometheus-stack-44.3.1    v0.62.0

kubectl get prometheuses.monitoring.coreos.com -n prometheus-system -oyaml
# podMonitorSelector:
#   matchLabels:
#     release: prometheus
# ruleSelector:
#   matchLabels:
#     release: prometheus
Prometheus uses
namespaceSelectorandselectorto select Kubernetes Pods.kubectl get pod -n default -l ray.io/node-type=head # NAME READY STATUS RESTARTS AGE # raycluster-embed-grafana-head-khfs4 1/1 Running 0 4m38s
relabelings: This configuration renames the label__meta_kubernetes_pod_label_ray_io_clustertoray_io_clusterin the scraped metrics. It ensures that each metric includes the name of the RayCluster to which the Pod belongs. This configuration is especially useful for distinguishing metrics when deploying multiple RayClusters. For example, a metric with theray_io_clusterlabel might look like this:ray_node_cpu_count{SessionName="session_2025-01-02_07-58-21_419367_11", container="ray-head", endpoint="metrics", instance="10.244.0.13:8080", ip="10.244.0.13", job="raycluster-embed-grafana-head-svc", namespace="default", pod="raycluster-embed-grafana-head-98fqt", ray_io_cluster="raycluster-embed-grafana", service="raycluster-embed-grafana-head-svc"}
In this example,
raycluster-embed-grafanais the name of the RayCluster.
Step 6: Collect Worker Node metrics with PodMonitors#
Similar to the head Pod, this tutorial also uses a PodMonitor to collect metrics from worker Pods. The reason for using separate PodMonitors for head Pods and worker Pods is that the head Pod exposes multiple metric endpoints, whereas a worker Pod exposes only one.
Note: You could create a Kubernetes service with selectors a common label subset from our worker pods, however, this configuration is not ideal because the workers are independent from each other, that is, they aren’t a collection of replicas spawned by replicaset controller. Due to this behavior, avoid using a Kubernetes service for grouping them together.
apiVersion: monitoring.coreos.com/v1
kind: PodMonitor
metadata:
  name: ray-workers-monitor
  namespace: prometheus-system
  labels:
    # `release: $HELM_RELEASE`: Prometheus can only detect PodMonitor with this label.
    release: prometheus
spec:
  jobLabel: ray-workers
  # Only select Kubernetes Pods in the "default" namespace.
  namespaceSelector:
    matchNames:
      - default
  # Only select Kubernetes Pods with "matchLabels".
  selector:
    matchLabels:
      ray.io/node-type: worker
  # A list of endpoints allowed as part of this PodMonitor.
  podMetricsEndpoints:
  - port: metrics
    relabelings:
    - sourceLabels: [__meta_kubernetes_pod_label_ray_io_cluster]
      targetLabel: ray_io_cluster
PodMonitor in
namespaceSelectorandselectorare used to select Kubernetes Pods.kubectl get pod -n default -l ray.io/node-type=worker # NAME READY STATUS RESTARTS AGE # raycluster-kuberay-worker-workergroup-5stpm 1/1 Running 0 3h16m
Step 7: Scrape KubeRay metrics with ServiceMonitor#
See the official ServiceMonitor doc for more details about configurations.
KubeRay operator provides metrics for RayCluster, RayService, and RayJob. See KubeRay metrics references for more details.
Prometheus uses
namespaceSelectorandselectorto select Kubernetes Service.
kubectl get service -n default -l app.kubernetes.io/name=kuberay-operator
NAME               TYPE        CLUSTER-IP      EXTERNAL-IP   PORT(S)    AGE
kuberay-operator   ClusterIP   10.96.205.229   <none>        8080/TCP   53m
Step 8: Collect custom metrics with recording rules#
Recording Rules allow KubeRay to precompute frequently needed or computationally expensive PromQL expressions and save their result as custom metrics. Note that this behavior is different from Custom application-level metrics, which are for the visibility of Ray applications.
apiVersion: monitoring.coreos.com/v1
kind: PrometheusRule
metadata:
  name: ray-cluster-gcs-rules
  namespace: prometheus-system
  labels:
    # `release: $HELM_RELEASE`: Prometheus can only detect Recording Rules with this label.
    release: prometheus
spec:
  groups:
- #  Rules within a group are run periodically with the same evaluation interval(30s in this example).
    name: ray-cluster-main-staging-gcs.rules
    # How often rules in the group are evaluated.
    interval: 30s
    rules:
    - # The name of the custom metric.
      # Also see best practices for naming metrics created by recording rules:
      # https://prometheus.io/docs/practices/rules/#recording-rules
      record: ray_gcs_availability_30d
      # PromQL expression.
      expr: |
      (
        100 * (
          sum(rate(ray_gcs_update_resource_usage_time_bucket{container="ray-head", le="20.0"}[30d]))
          /
          sum(rate(ray_gcs_update_resource_usage_time_count{container="ray-head"}[30d]))
        )
      )
The PromQL expression above is: $\(\frac{ number\ of\ update\ resource\ usage\ RPCs\ that\ have\ RTT\ smaller\ then\ 20ms\ in\ last\ 30\ days\ }{total\ number\ of\ update\ resource\ usage\ RPCs\ in\ last\ 30\ days\ } \times 100 \)$
The recording rule above is one of rules defined in prometheusRules.yaml, and it is created by install.sh. Hence, no need to create anything here.
See the official PrometheusRule document for more details about configurations.
release: $HELM_RELEASE: Prometheus can only detect PrometheusRule with this label. See here for more details.PrometheusRule can be reloaded at runtime. Use
kubectl apply {modified prometheusRules.yaml}to reconfigure the rules if needed.
Step 9: Define Alert Conditions with alerting rules (optional)#
Alerting rules allow us to define alert conditions based on PromQL expressions and to send notifications about firing alerts to Alertmanager which adds summarization, notification rate limiting, silencing and alert dependencies on top of the simple alert definitions.
apiVersion: monitoring.coreos.com/v1
kind: PrometheusRule
metadata:
  name: ray-cluster-gcs-rules
  namespace: prometheus-system
  labels:
    # `release: $HELM_RELEASE`: Prometheus can only detect Alerting Rules with this label.
    release: prometheus
spec:
  groups:
  - name: ray-cluster-main-staging-gcs.rules
    # How often rules in the group are evaluated.
    interval: 30s
    rules:
    - alert: MissingMetricRayGlobalControlStore
      # A set of informational labels. Annotations can be used to store longer additional information compared to rules.0.labels.
      annotations:
        description: Ray GCS is not emitting any metrics for Resource Update requests
        summary: Ray GCS is not emitting metrics anymore
      # PromQL expression.
      expr: |
                      (
                       absent(ray_gcs_update_resource_usage_time_bucket) == 1
                      )
      # Time that Prometheus will wait and check if the alert continues to be active during each evaluation before firing the alert.
      # firing alerts may be due to false positives or noise if the setting value is too small.
      # On the other hand, if the value is too big, the alerts may not be handled in time.
      for: 5m
      # A set of additional labels to be attached to the alert.
      # It is possible to overwrite the labels in metadata.labels, so make sure one of the labels match the label in ruleSelector.matchLabels.
      labels:
        severity: critical
The PromQL expression above checks if there is no time series exist for
ray_gcs_update_resource_usage_time_bucketmetric. See absent() for more detail.The alerting rule above is one of rules defined in prometheusRules.yaml, and it is created by install.sh. Hence, no need to create anything here.
Alerting rules are configured in the same way as recording rules.
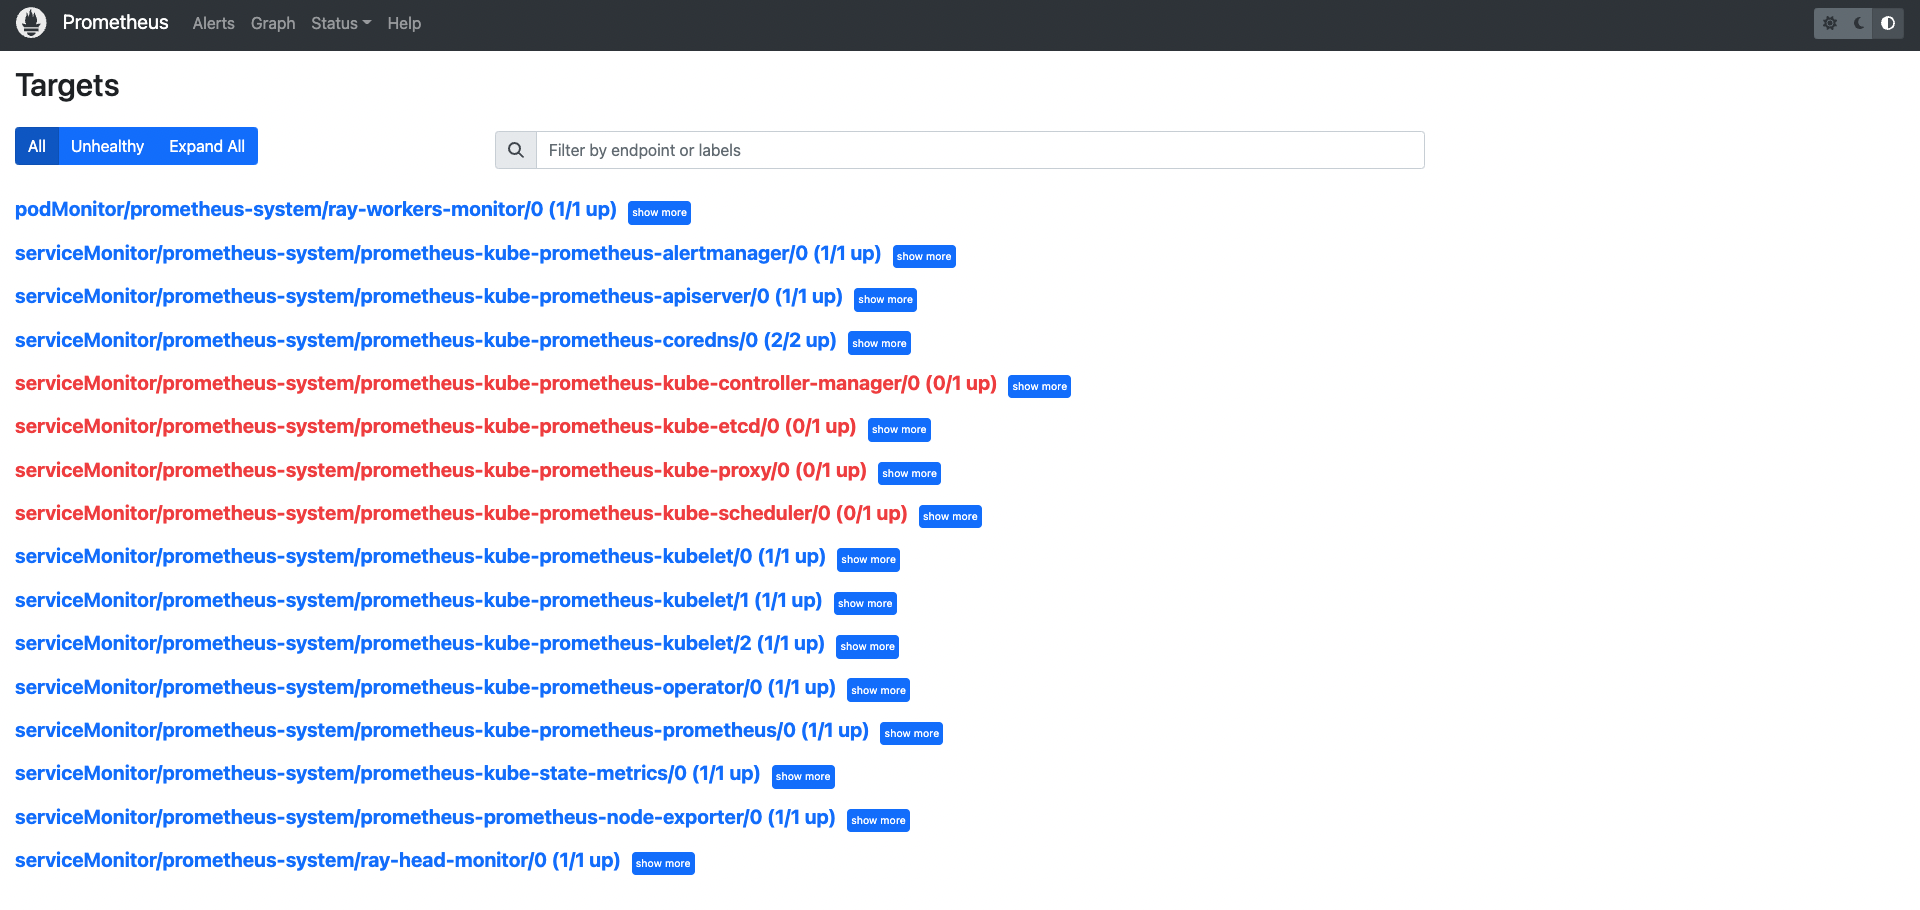
Step 10: Access Prometheus Web UI#
# Forward the port of Prometheus Web UI in the Prometheus server Pod.
kubectl port-forward -n prometheus-system service/prometheus-kube-prometheus-prometheus http-web
Go to
${YOUR_IP}:9090/targets(e.g.127.0.0.1:9090/targets). You should be able to see:podMonitor/prometheus-system/ray-workers-monitor/0 (1/1 up)serviceMonitor/prometheus-system/ray-head-monitor/0 (1/1 up)
Go to
${YOUR_IP}:9090/graph. You should be able to query:Custom Metrics defined in Recording Rules (e.g.
ray_gcs_availability_30d)
Go to
${YOUR_IP}:9090/alerts. You should be able to see:Alerting Rules (e.g.
MissingMetricRayGlobalControlStore).
Step 11: Access Grafana#
# Forward the Grafana port
kubectl port-forward -n prometheus-system service/prometheus-grafana 3000:http-web
# Note: You need to update `RAY_GRAFANA_IFRAME_HOST` if you expose Grafana to a different port.

# Check ${YOUR_IP}:3000/login for the Grafana login page (e.g. 127.0.0.1:3000/login).
# The default username is "admin" and the password is "prom-operator".
Note:
kubectl port-forwardis not recommended for production use. Refer to this Grafana document for exposing Grafana behind a reverse proxy.
The default password is defined by
grafana.adminPasswordin the values.yaml of the kube-prometheus-stack chart.
Step 12: Import Grafana dashboards manually (optional)#
If --auto-load-dashboard true is set when running install.sh, you can skip this step.
Import Grafana dashboards manually
Click “Dashboards” icon in the left panel.
Click “New”.
Click “Import”.
Click “Upload JSON file”.
Choose a JSON file.
Case 1: If you are using Ray 2.41.0, you can use the sample config files in GitHub repository. The file names have a pattern of
xxx_grafana_dashboard.json.Case 2: Otherwise, import the JSON files from the head Pod’s
/tmp/ray/session_latest/metrics/grafana/dashboards/directory. You can usekubectl cpto copy the files from the head Pod to your local machine.kubectl cp $(kubectl get pods --selector ray.io/node-type=head,ray.io/cluster=raycluster-embed-grafana -o jsonpath={..metadata.name}):/tmp/ray/session_latest/metrics/grafana/dashboards/ /tmp/
Click “Import”.
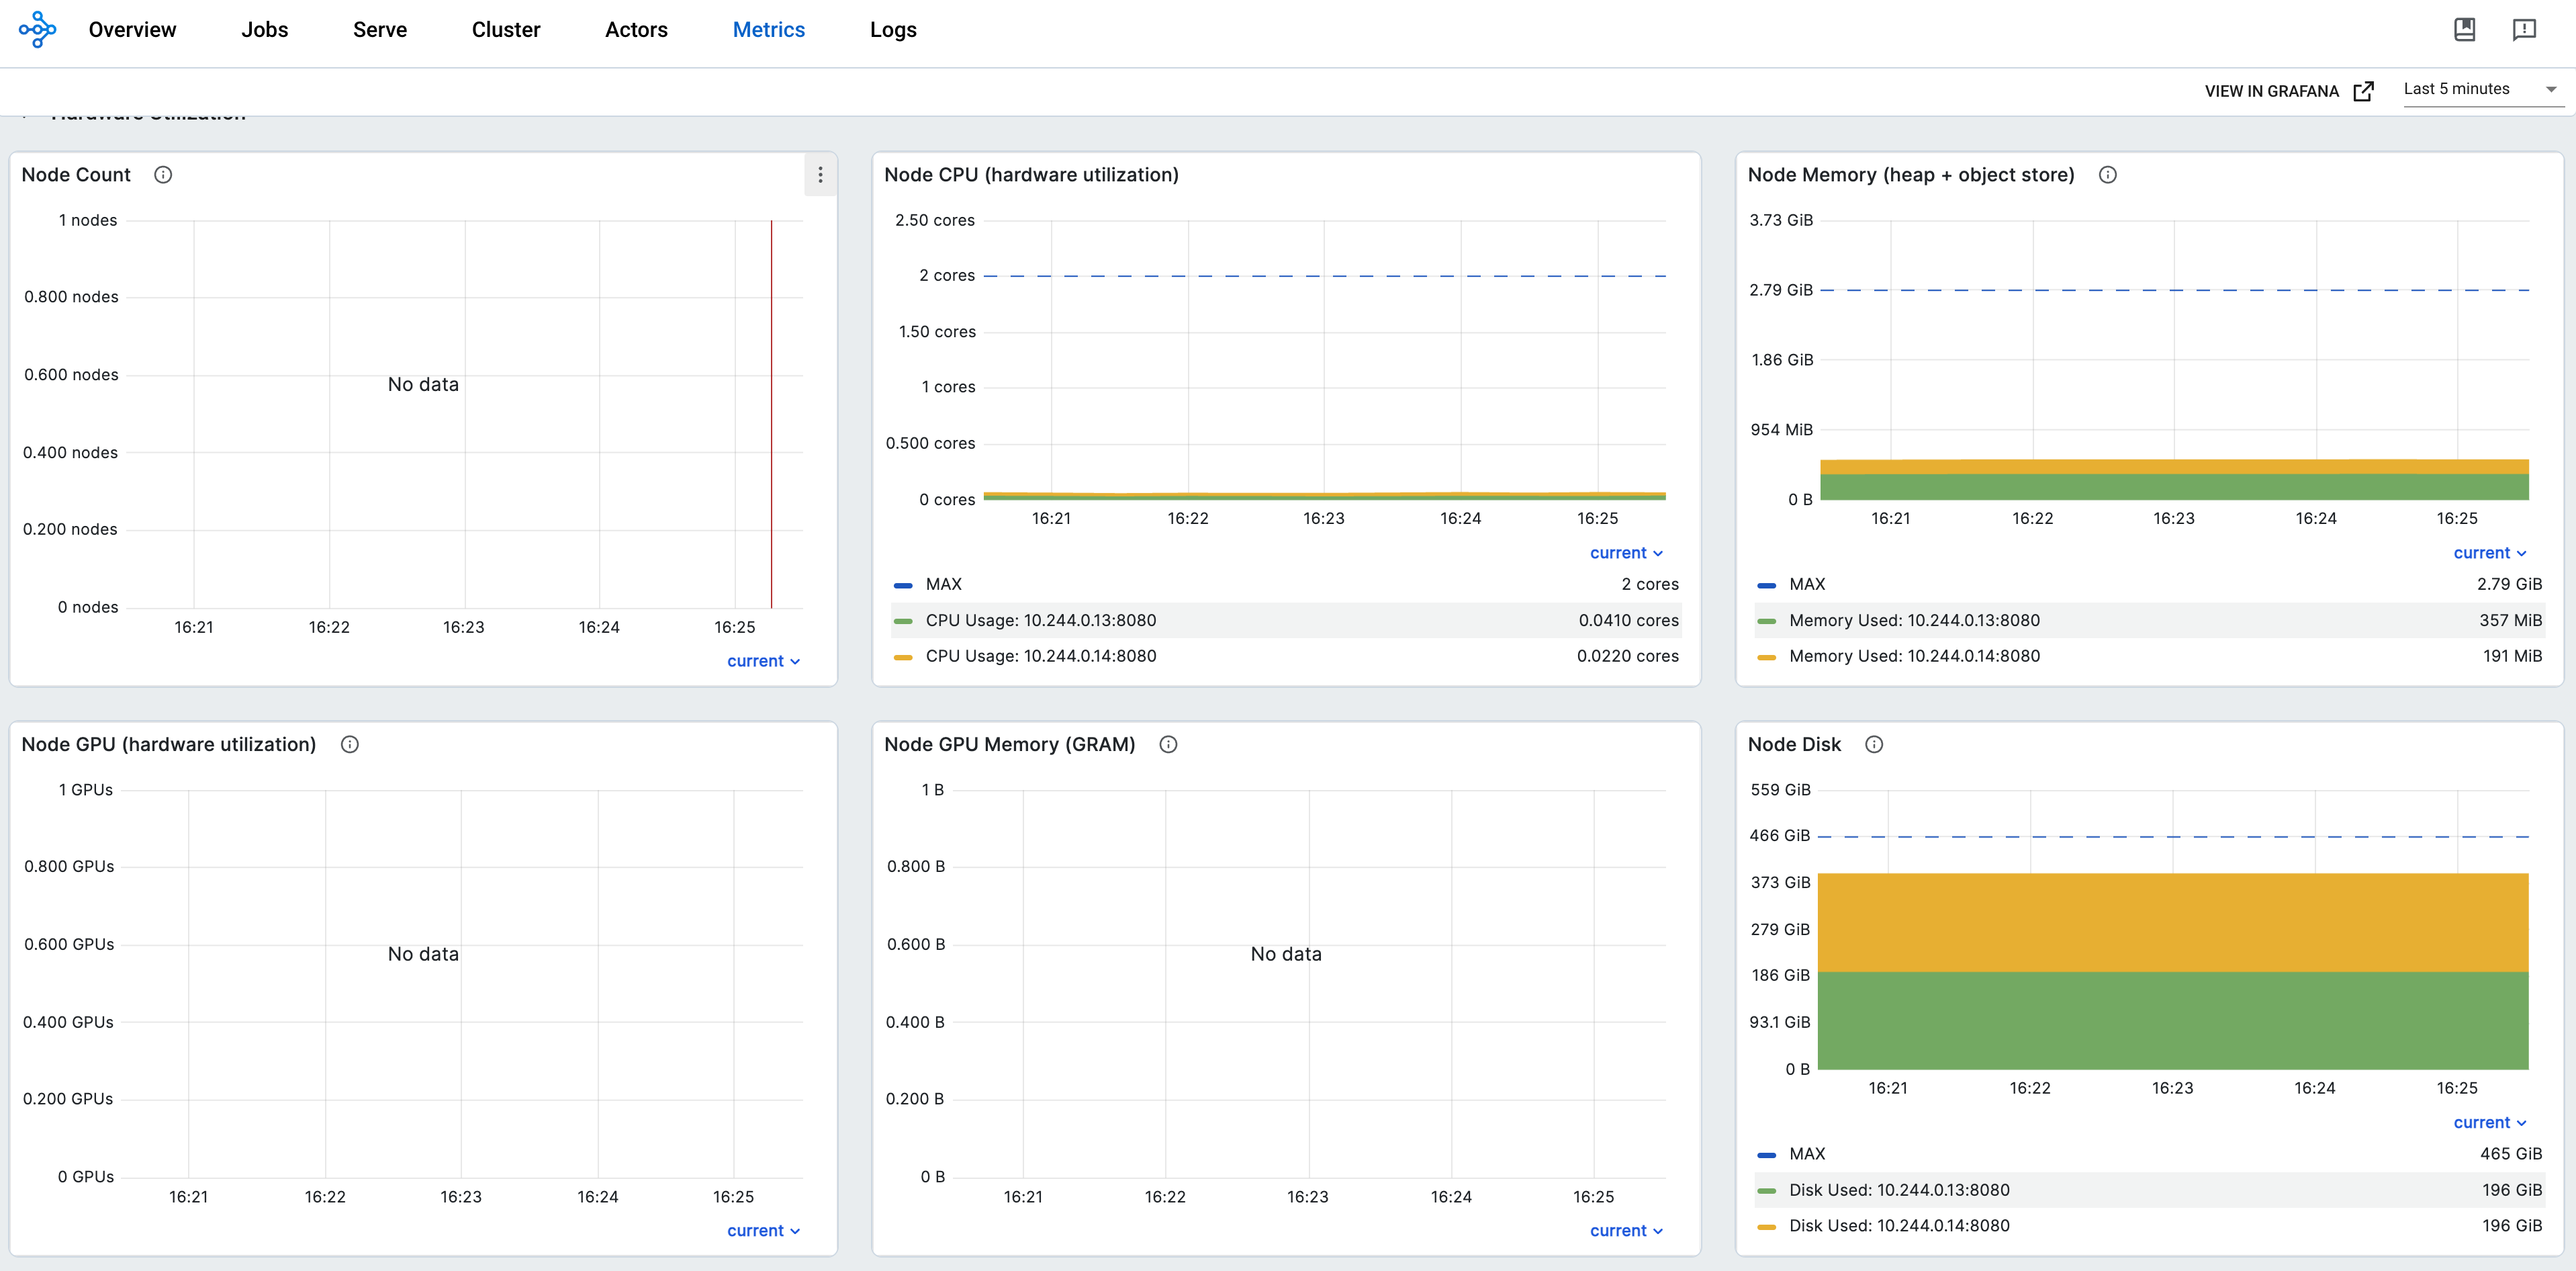
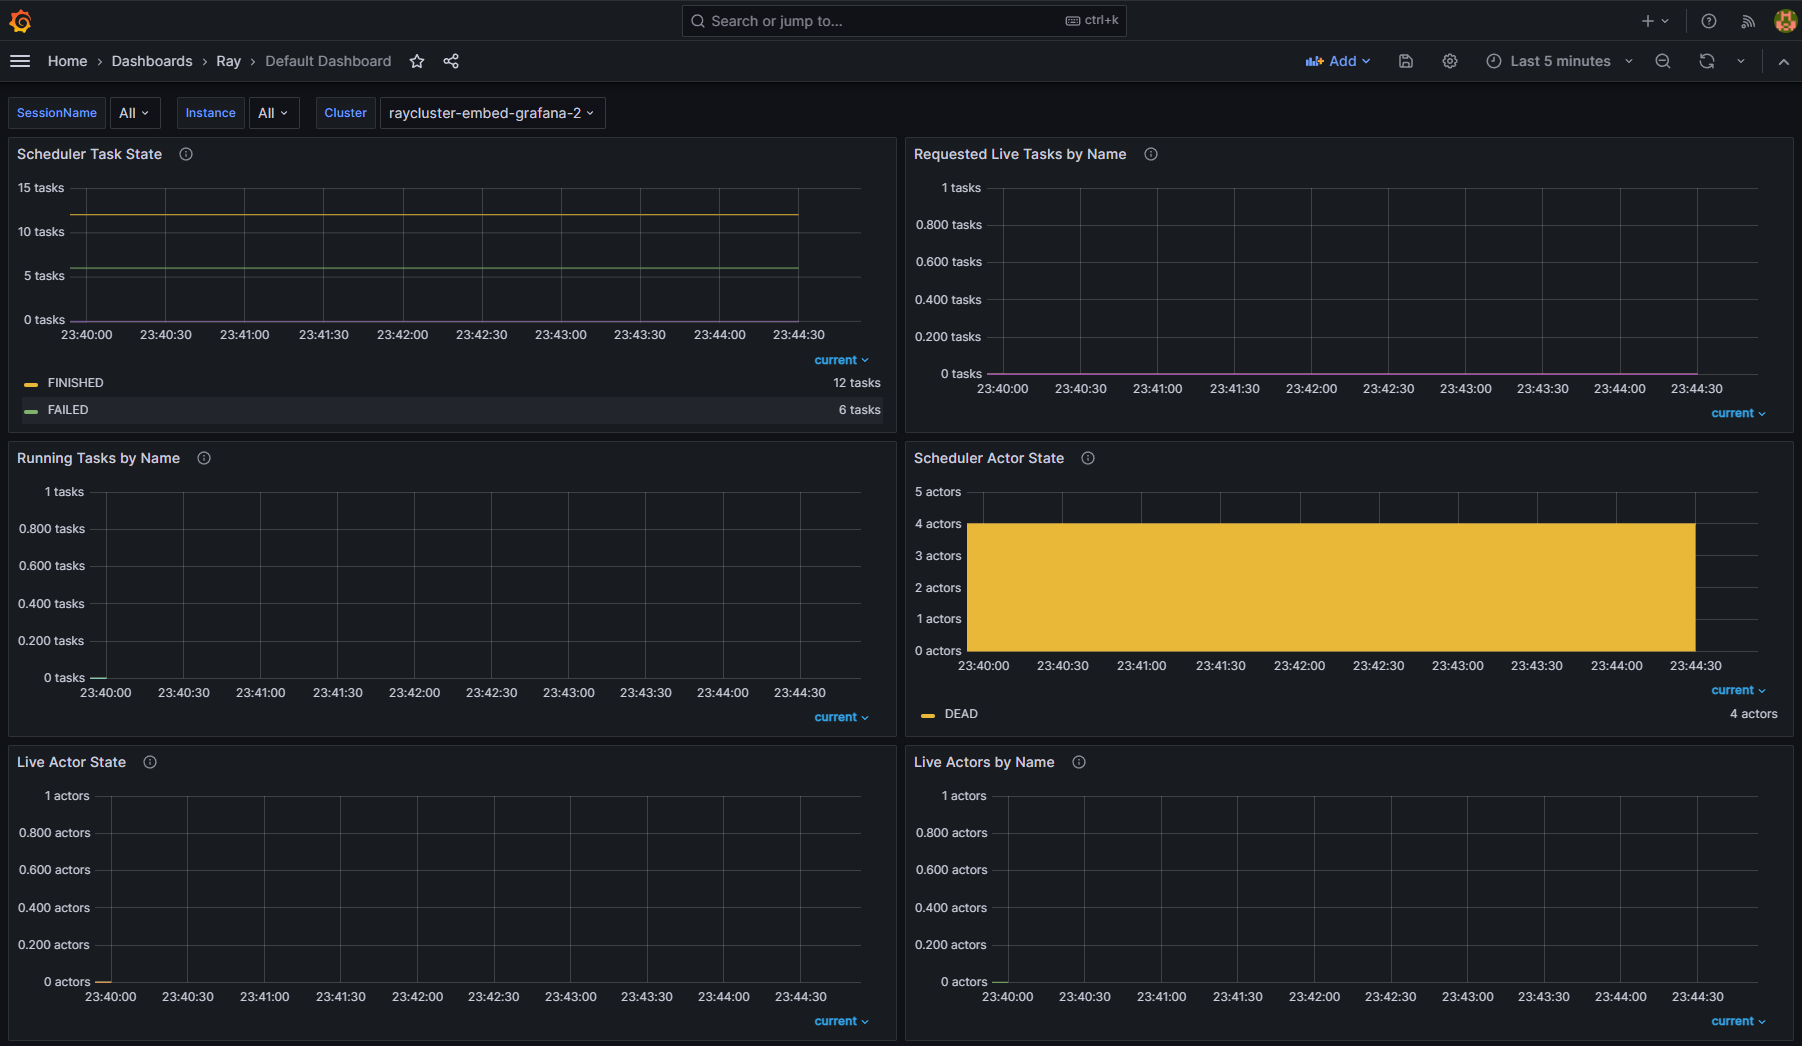
Step 13: View metrics from different RayCluster CRs#
Once the Ray Dashboard is imported into Grafana, you can filter metrics by using the Cluster variable. Ray Dashboard automatically applies this variable by default when you use the provided PodMonitor configuration. You don’t need any additional setup for this labeling.
If you have multiple RayCluster custom resources, the Cluster variable allows you to filter metrics specific to a particular cluster. This feature ensures that you can easily monitor or debug individual RayCluster instances without being overwhelmed by the data from all clusters.
For example, in the following figures, one selects the metrics from the RayCluster raycluster-embed-grafana, and the other selects metrics from the RayCluster raycluster-embed-grafana-2.
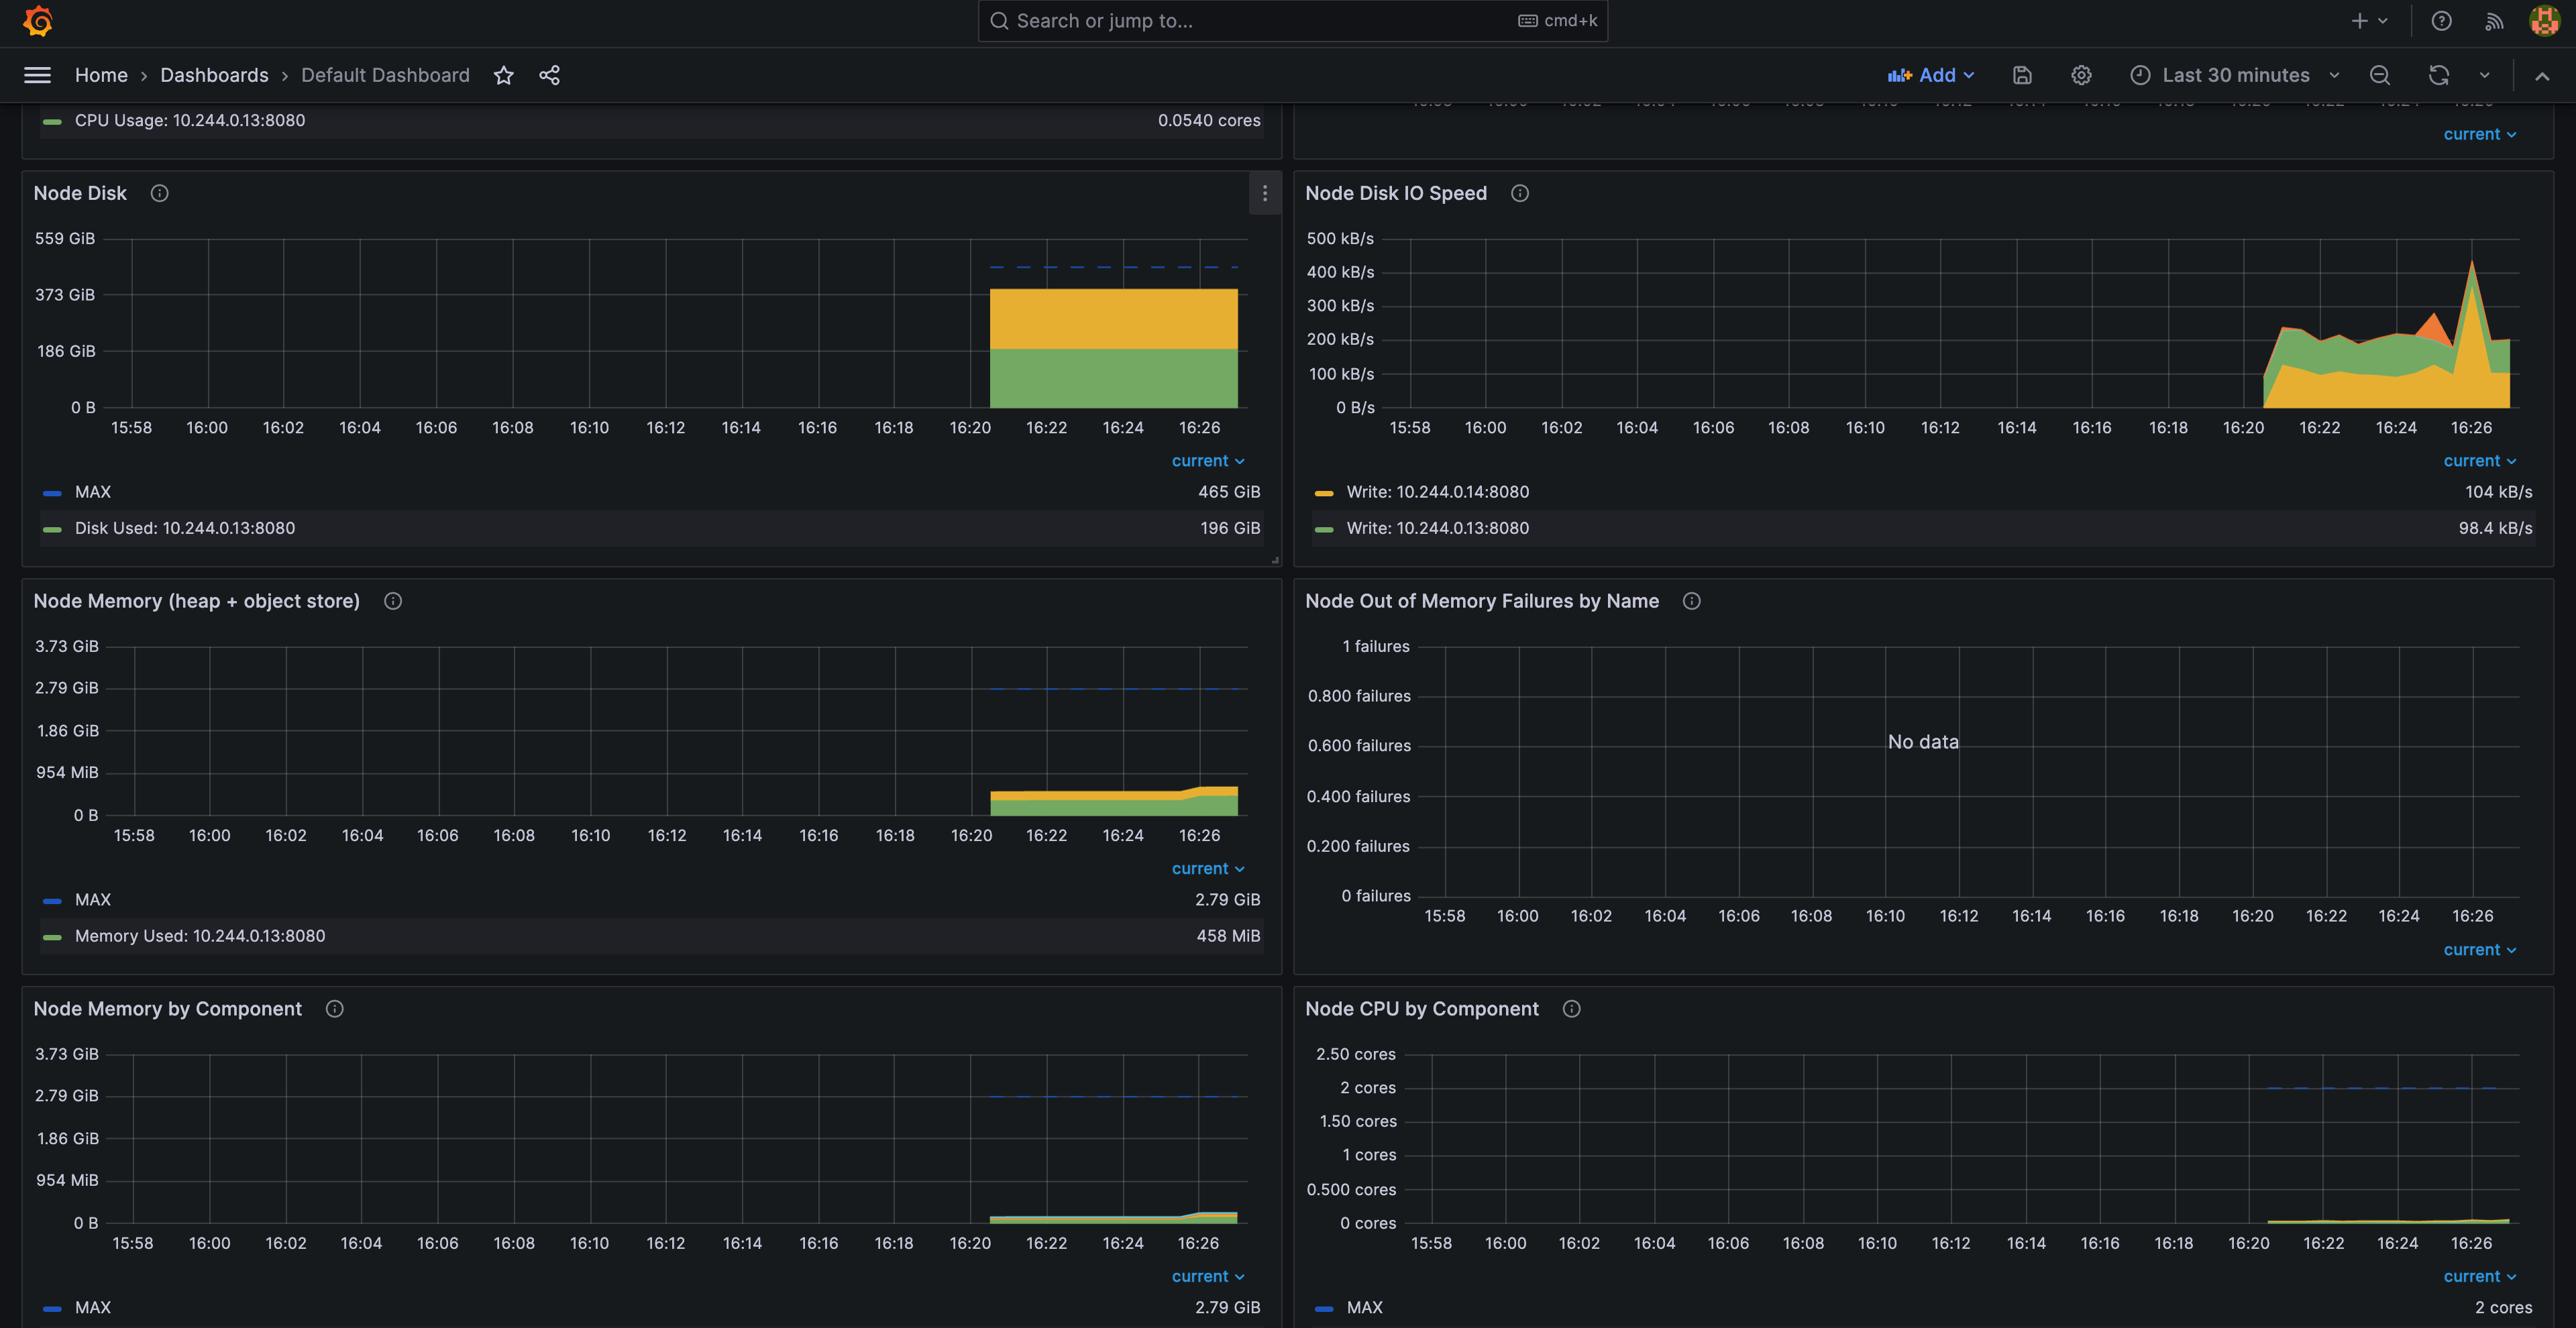
Step 14: View the KubeRay operator dashboard#
After importing the KubeRay operator dashboard into Grafana, you can monitor metrics from the KubeRay operator. The dashboard includes a dropdown menu that lets you filter and view controller runtime metrics for specific Ray custom resources CRs: RayCluster, RayJob, and RayService.
The KubeRay operator dashboard should look like this: 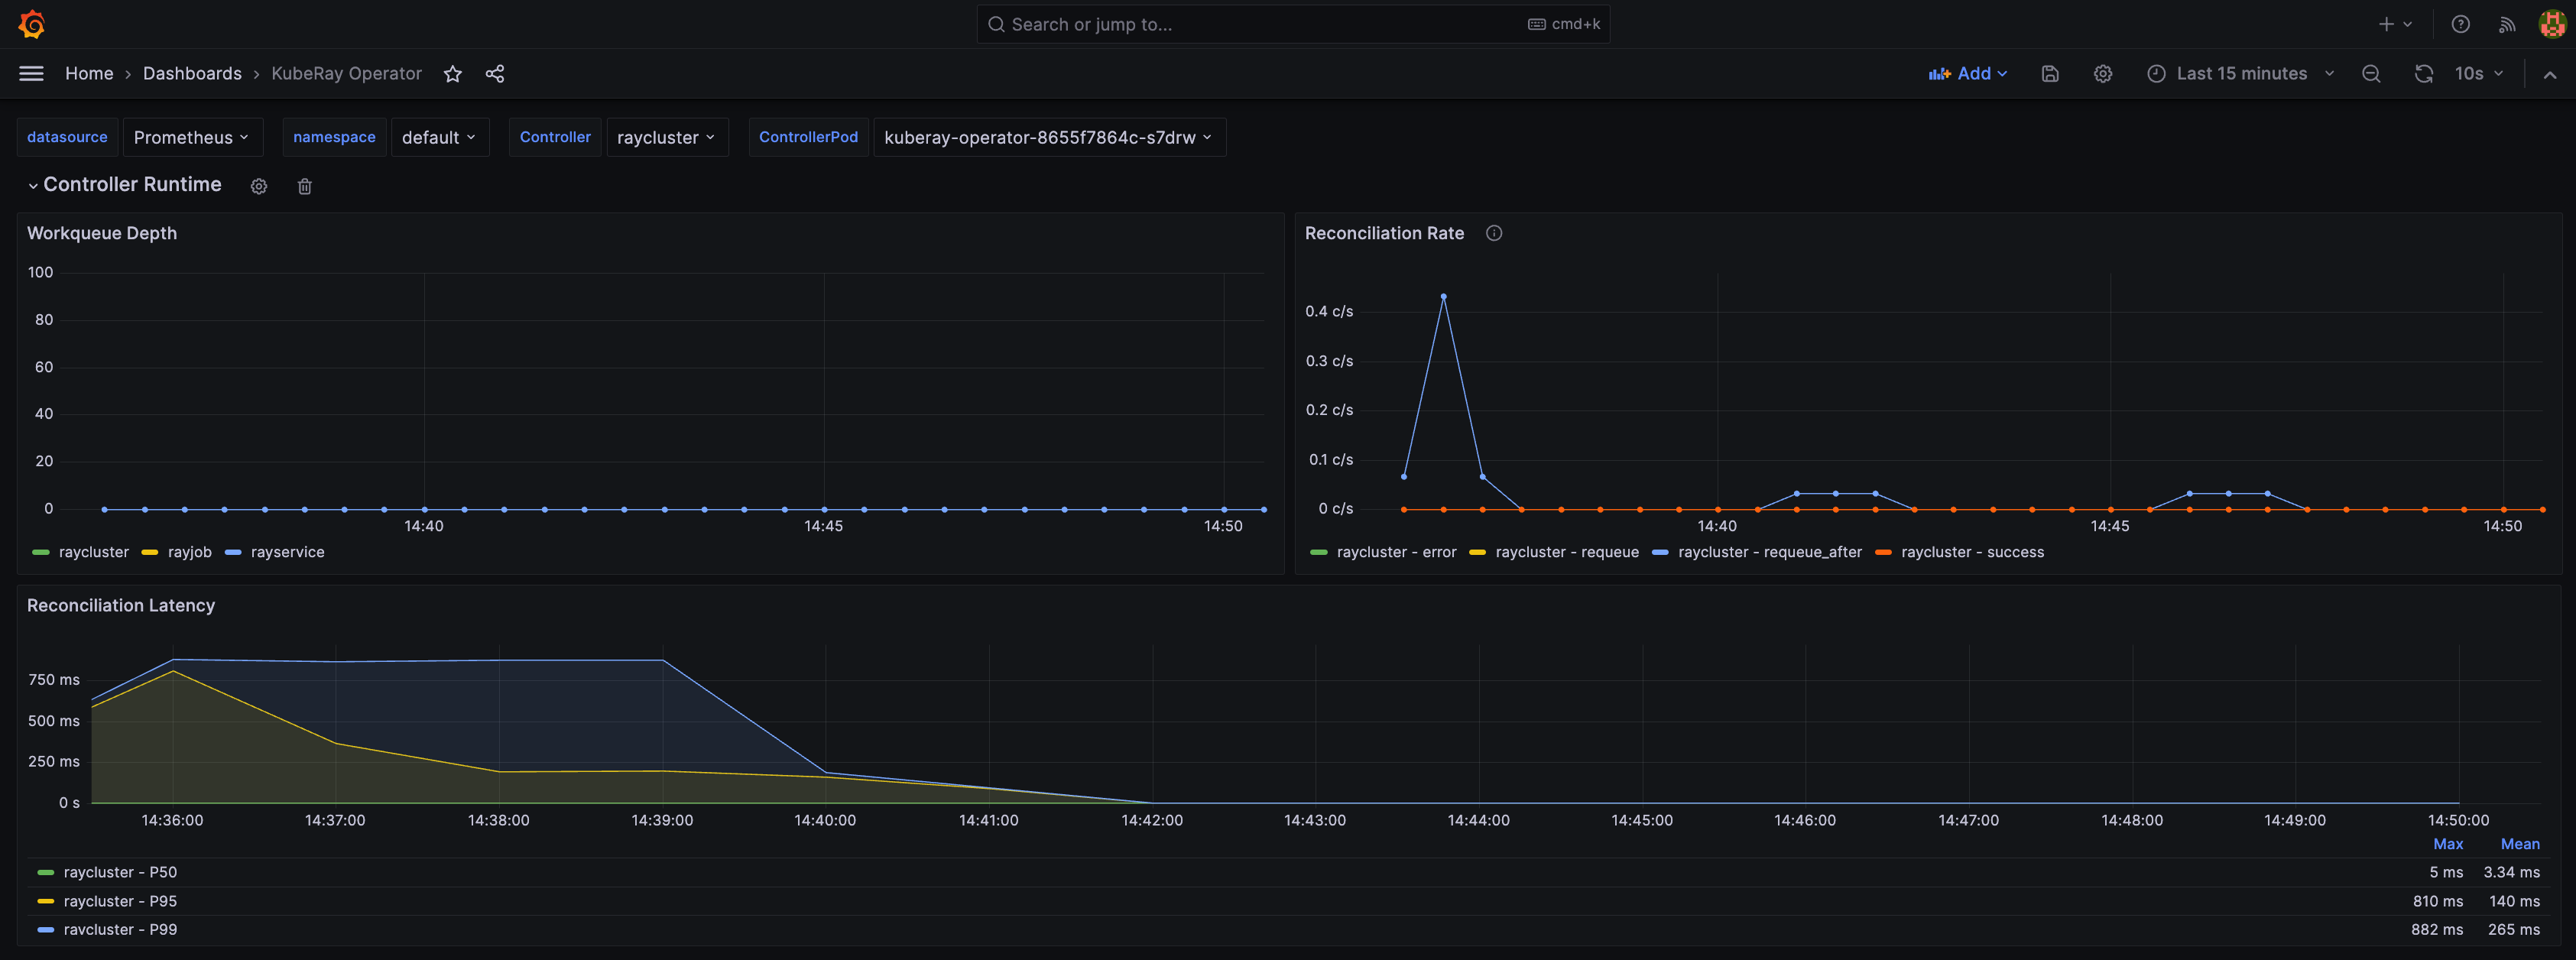
Step 15: Embed Grafana panels in the Ray dashboard (optional)#
kubectl port-forward service/raycluster-embed-grafana-head-svc dashboard
# Visit http://127.0.0.1:8265/#/metrics in your browser.