Monitor Your Application#
This section helps you debug and monitor your Serve applications by:
viewing the Ray dashboard
viewing the
serve statusoutputusing Ray logging and Loki
inspecting built-in Ray Serve metrics
exporting metrics into Arize platform
Ray Dashboard#
You can use the Ray dashboard to get a high-level overview of your Ray cluster and Ray Serve application’s states. This includes details such as:
the number of deployment replicas currently running
logs for your Serve controller, deployment replicas, and proxies
the Ray nodes (i.e. machines) running in your Ray cluster.
You can access the Ray dashboard at port 8265 at your cluster’s URI. For example, if you’re running Ray Serve locally, you can access the dashboard by going to http://localhost:8265 in your browser.
View important information about your application by accessing the Serve page.
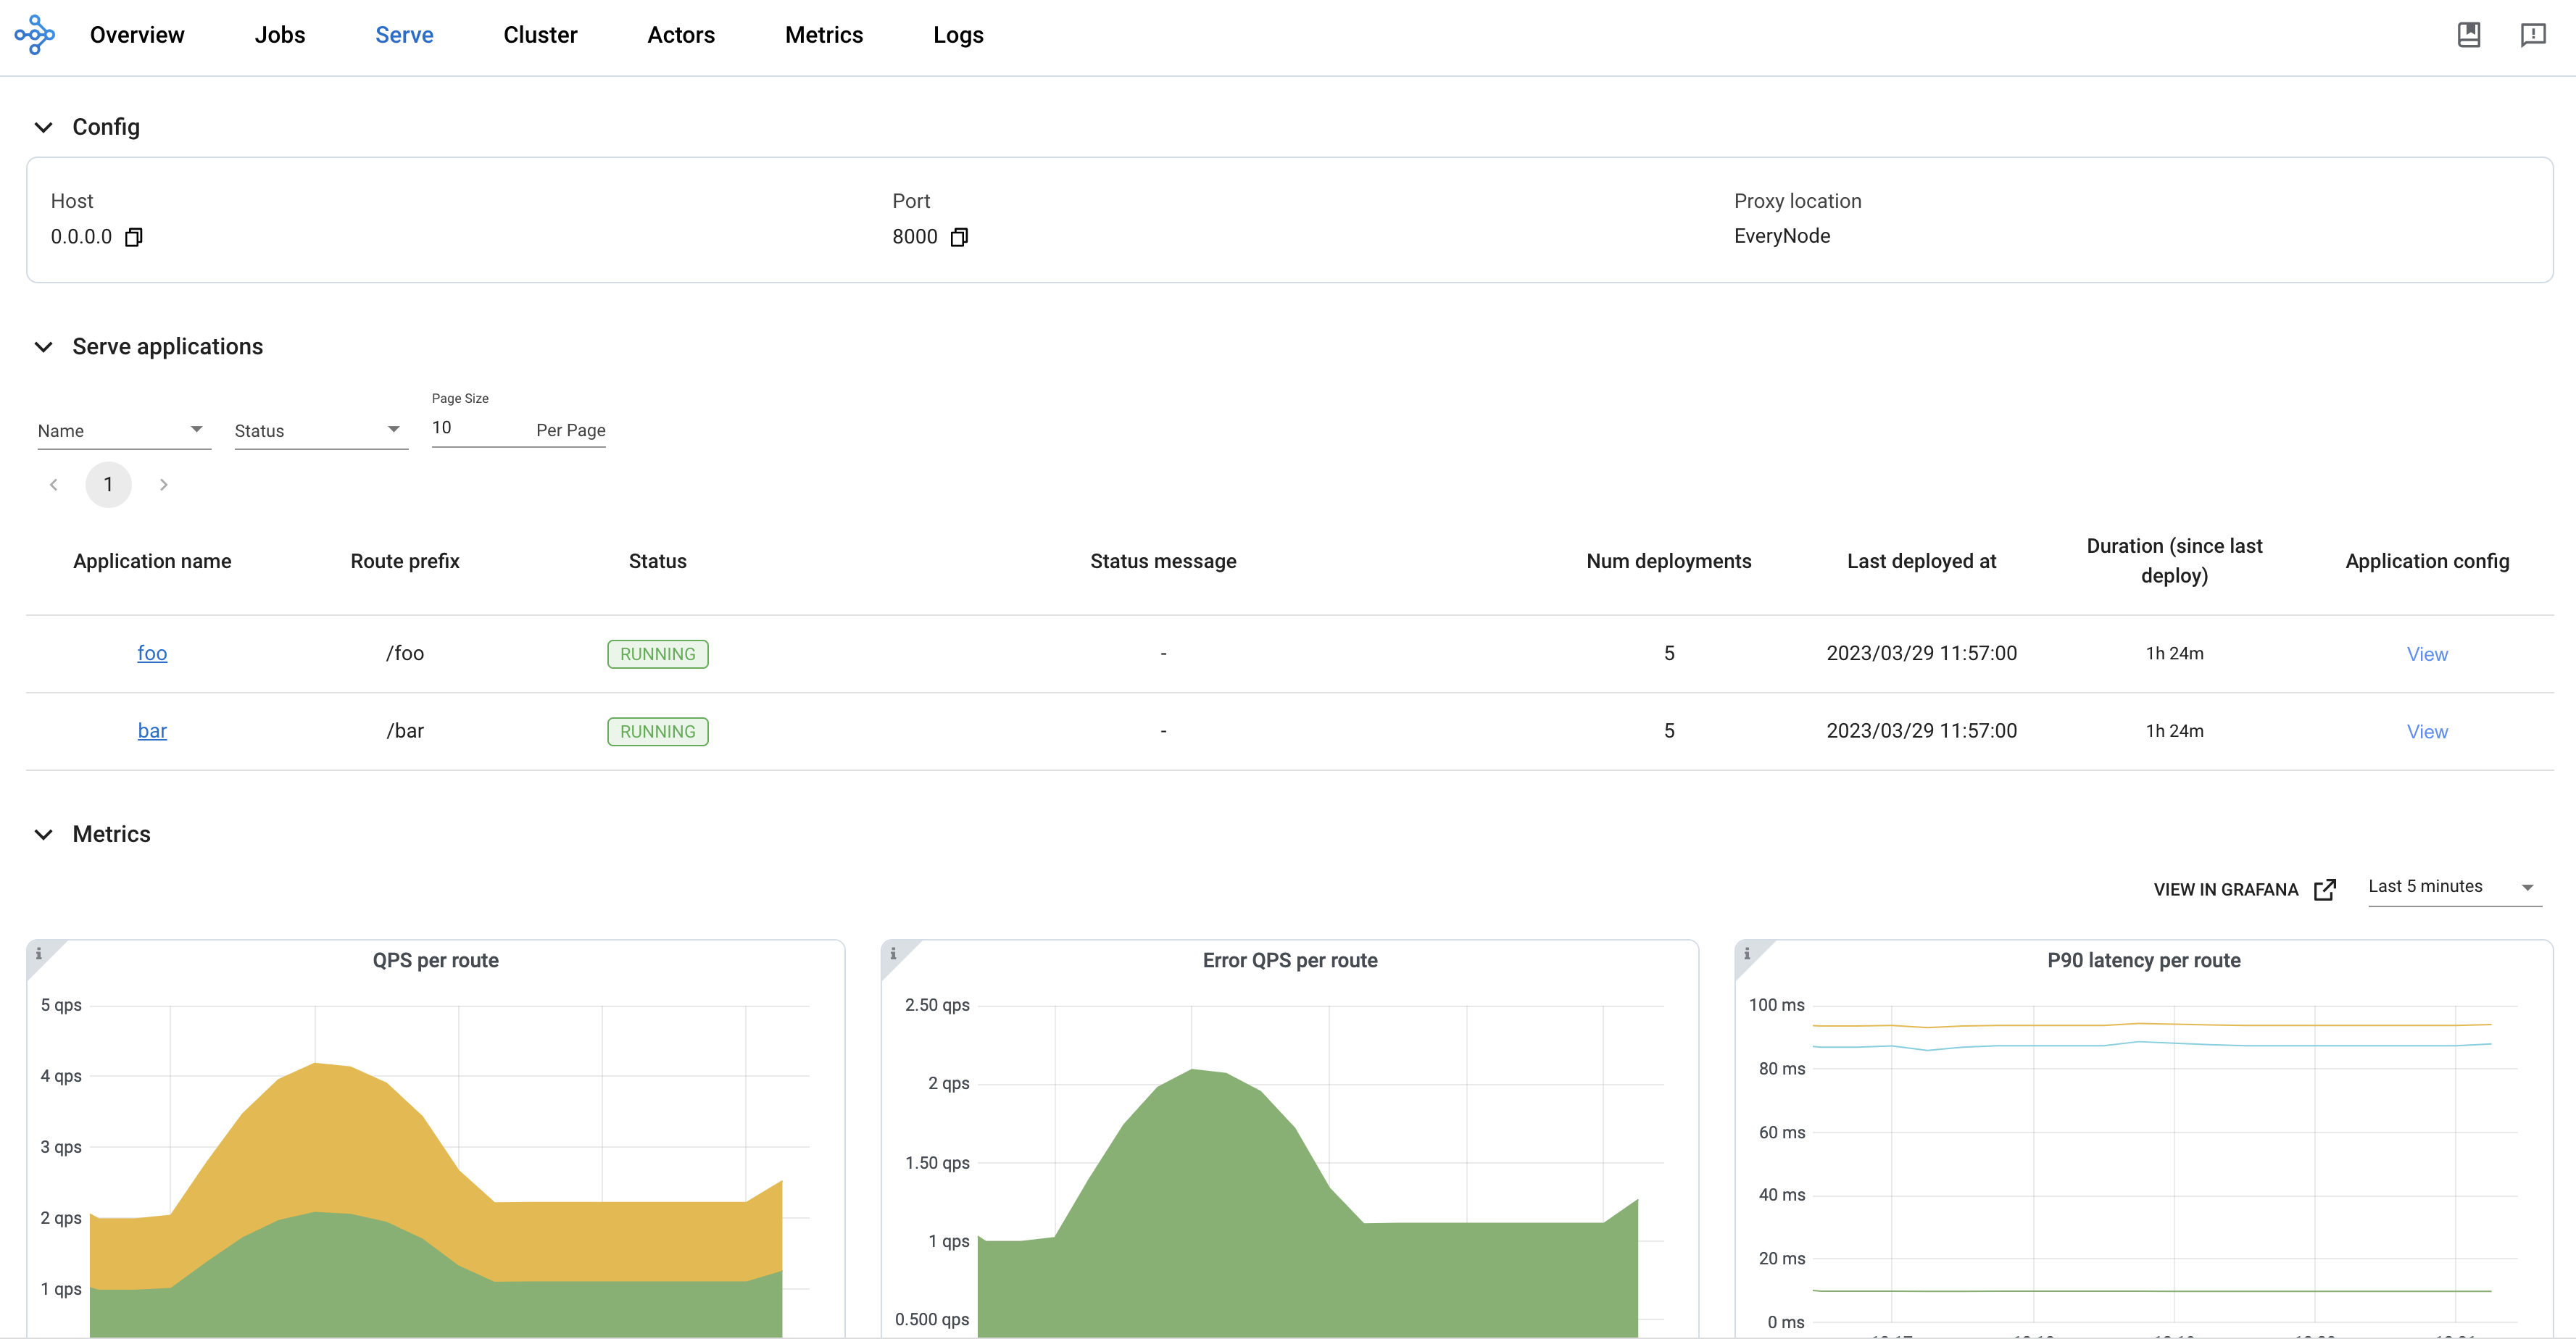
This example has a single-node cluster running a deployment named Translator. This deployment has 2 replicas.
View details of these replicas by browsing the Serve page. On the details page of each replica. From there, you can view metadata about the replica and the logs of the replicas, including the logging and print statements generated by the replica process.
Another useful view is the Actors view. This example Serve application uses four Ray actors:
1 Serve controller
1 HTTP proxy
2
Translatordeployment replicas
You can see the details of these entities throughout the Serve page and in the actor’s page. This page includes additional useful information like each actor’s process ID (PID) and a link to each actor’s logs. You can also see whether any particular actor is alive or dead to help you debug potential cluster failures.
Tip
To learn more about the Serve controller actor, the HTTP proxy actor(s), the deployment replicas, and how they all work together, check out the Serve Architecture documentation.
For a detailed overview of the Ray dashboard, see the dashboard documentation.
Inspect applications with the Serve CLI#
Two Serve CLI commands help you inspect a Serve application in production: serve config and serve status. If you have a remote cluster, serve config and serve status also has an --address/-a argument to access the cluster. See VM deployment for more information on this argument.
serve config gets the latest config file that the Ray Cluster received. This config file represents the Serve application’s goal state. The Ray Cluster constantly strives to reach and maintain this state by deploying deployments, recovering failed replicas, and performing other relevant actions.
Using the serve_config.yaml example from the production guide:
$ ray start --head
$ serve deploy serve_config.yaml
...

$ serve config
name: default
route_prefix: /
import_path: text_ml:app
runtime_env:
  pip:
    - torch
    - transformers
deployments:
- name: Translator
  num_replicas: 1
  user_config:
    language: french
- name: Summarizer
  num_replicas: 1
serve status gets your Serve application’s current status. This command reports the status of the proxies and the applications running on the Ray cluster.
proxies lists each proxy’s status. Each proxy is identified by the node ID of the node that it runs on. A proxy has three possible statuses:
STARTING: The proxy is starting up and is not yet ready to serve requests.HEALTHY: The proxy is capable of serving requests. It is behaving normally.UNHEALTHY: The proxy has failed its health-checks. It will be killed, and a new proxy will be started on that node.DRAINING: The proxy is healthy but is closed to new requests. It may contain pending requests that are still being processed.DRAINED: The proxy is closed to new requests. There are no pending requests.
applications contains a list of applications, their overall statuses, and their deployments’ statuses. Each entry in applications maps an application’s name to four fields:
status: A Serve application has four possible overall statuses:"NOT_STARTED": No application has been deployed on this cluster."DEPLOYING": The application is currently carrying out aserve deployrequest. It is deploying new deployments or updating existing ones."RUNNING": The application is at steady-state. It has finished executing any previousserve deployrequests, and is attempting to maintain the goal state set by the latestserve deployrequest."DEPLOY_FAILED": The latestserve deployrequest has failed.
message: Provides context on the current status.deployment_timestamp: A UNIX timestamp of when Serve received the lastserve deployrequest. The timestamp is calculated using theServeController’s local clock.deployments: A list of entries representing each deployment’s status. Each entry maps a deployment’s name to three fields:status: A Serve deployment has six possible statuses:"UPDATING": The deployment is updating to meet the goal state set by a previousdeployrequest."HEALTHY": The deployment is healthy and running at the target replica count."UNHEALTHY": The deployment has updated and has become unhealthy afterwards. This condition may be due to replicas failing to upscale, replicas failing health checks, or a general system or machine error."DEPLOY_FAILED": The deployment failed to start or update. This condition is likely due to an error in the deployment’s constructor."UPSCALING": The deployment (with autoscaling enabled) is upscaling the number of replicas."DOWNSCALING": The deployment (with autoscaling enabled) is downscaling the number of replicas.
replica_states: A list of the replicas’ states and the number of replicas in that state. Each replica has five possible states:STARTING: The replica is starting and not yet ready to serve requests.UPDATING: The replica is undergoing areconfigureupdate.RECOVERING: The replica is recovering its state.RUNNING: The replica is running normally and able to serve requests.STOPPING: The replica is being stopped.
message: Provides context on the current status.
Use the serve status command to inspect your deployments after they are deployed and throughout their lifetime.
Using the serve_config.yaml example from an earlier section:
$ ray start --head
$ serve deploy serve_config.yaml
...

$ serve status
proxies:
  cef533a072b0f03bf92a6b98cb4eb9153b7b7c7b7f15954feb2f38ec: HEALTHY
applications:
  default:
    status: RUNNING
    message: ''
    last_deployed_time_s: 1694041157.2211847
    deployments:
      Translator:
        status: HEALTHY
        replica_states:
          RUNNING: 1
        message: ''
      Summarizer:
        status: HEALTHY
        replica_states:
          RUNNING: 1
        message: ''
For Kubernetes deployments with KubeRay, tighter integrations of serve status with Kubernetes are available. See Getting the status of Serve applications in Kubernetes.
Get application details in Python#
Call the serve.status() API to get Serve application details in Python. serve.status() returns the same information as the serve status CLI command inside a dataclass. Use this method inside a deployment or a Ray driver script to obtain live information about the Serve applications on the Ray cluster. For example, this monitoring_app reports all the RUNNING Serve applications on the cluster:
from typing import List, Dict

from ray import serve
from ray.serve.schema import ServeStatus, ApplicationStatusOverview


@serve.deployment
def get_healthy_apps() -> List[str]:
    serve_status: ServeStatus = serve.status()
    app_statuses: Dict[str, ApplicationStatusOverview] = serve_status.applications

    running_apps = []
    for app_name, app_status in app_statuses.items():
        if app_status.status == "RUNNING":
            running_apps.append(app_name)

    return running_apps


monitoring_app = get_healthy_apps.bind()
Ray logging#
To understand system-level behavior and to surface application-level details during runtime, you can leverage Ray logging.
Ray Serve uses Python’s standard logging module with a logger named "ray.serve". By default, logs are emitted from actors both to stderr and on disk on each node at /tmp/ray/session_latest/logs/serve/. This includes both system-level logs from the Serve controller and proxy as well as access logs and custom user logs produced from within deployment replicas.
In development, logs are streamed to the driver Ray program (the Python script that calls serve.run() or the serve run CLI command), so it’s convenient to keep the driver running while debugging.
For example, let’s run a basic Serve application and view the logs that it emits.
First, let’s create a simple deployment that logs a custom log message when it’s queried:
# File name: monitoring.py

from ray import serve
import logging
from starlette.requests import Request

logger = logging.getLogger("ray.serve")


@serve.deployment
class SayHello:
    async def __call__(self, request: Request) -> str:
        logger.info("Hello world!")
        return "hi"


say_hello = SayHello.bind()
Run this deployment using the serve run CLI command:
$ serve run monitoring:say_hello

2023-04-10 15:57:32,100	INFO scripts.py:380 -- Deploying from import path: "monitoring:say_hello".
[2023-04-10 15:57:33]  INFO ray._private.worker::Started a local Ray instance. View the dashboard at http://127.0.0.1:8265
(ServeController pid=63503) INFO 2023-04-10 15:57:35,822 controller 63503 deployment_state.py:1168 - Deploying new version of deployment SayHello.
(ProxyActor pid=63513) INFO:     Started server process [63513]
(ServeController pid=63503) INFO 2023-04-10 15:57:35,882 controller 63503 deployment_state.py:1386 - Adding 1 replica to deployment SayHello.
2023-04-10 15:57:36,840	SUCC scripts.py:398 -- Deployed Serve app successfully.
serve run prints a few log messages immediately. Note that a few of these messages start with identifiers such as
(ServeController pid=63881)
These messages are logs from Ray Serve actors. They describe which actor (Serve controller, proxy, or deployment replica) created the log and what its process ID is (which is useful when distinguishing between different deployment replicas or proxies). The rest of these log messages are the actual log statements generated by the actor.
While serve run is running, we can query the deployment in a separate terminal window:
curl -X GET http://localhost:8000/
This causes the HTTP proxy and deployment replica to print log statements to the terminal running serve run:
(ServeReplica:SayHello pid=63520) INFO 2023-04-10 15:59:45,403 SayHello SayHello#kTBlTj HzIYOzaEgN / monitoring.py:16 - Hello world!
(ServeReplica:SayHello pid=63520) INFO 2023-04-10 15:59:45,403 SayHello SayHello#kTBlTj HzIYOzaEgN / replica.py:527 - __CALL__ OK 0.5ms
Note
Log messages include the logging level, timestamp, deployment name, replica tag, request ID, route, file name, and line number.
Find a copy of these logs at /tmp/ray/session_latest/logs/serve/. You can parse these stored logs with a logging stack such as ELK or Loki to be able to search by deployment or replica.
Serve supports Log Rotation of these logs through setting the environment variables RAY_ROTATION_MAX_BYTES and RAY_ROTATION_BACKUP_COUNT.
To silence the replica-level logs or otherwise configure logging, configure the "ray.serve" logger inside the deployment constructor:
import logging

logger = logging.getLogger("ray.serve")

@serve.deployment
class Silenced:
    def __init__(self):
        logger.setLevel(logging.ERROR)
This controls which logs are written to STDOUT or files on disk. In addition to the standard Python logger, Serve supports custom logging. Custom logging lets you control what messages are written to STDOUT/STDERR, files on disk, or both.
For a detailed overview of logging in Ray, see Ray Logging.
Configure Serve logging#
From ray 2.9, the logging_config API configures logging for Ray Serve. You can configure logging for Ray Serve. Pass a dictionary or object of LoggingConfig to the logging_config argument of serve.run or @serve.deployment.
Configure logging format#
You can configure the JSON logging format by passing encoding=JSON to logging_config argument in serve.run or @serve.deployment
import requests
from ray import serve
from ray.serve.schema import LoggingConfig


@serve.deployment
class Model:
    def __call__(self) -> int:
        return "hello world"


serve.run(Model.bind(), logging_config=LoggingConfig(encoding="JSON"))

resp = requests.get("http://localhost:8000/")
import requests
from ray import serve
from ray.serve.schema import LoggingConfig


@serve.deployment(logging_config=LoggingConfig(encoding="JSON"))
class Model:
    def __call__(self) -> int:
        return "hello world"


serve.run(Model.bind())

resp = requests.get("http://localhost:8000/")
In the replica Model log file, you should see the following:
# cat `ls /tmp/ray/session_latest/logs/serve/replica_default_Model_*`

{"levelname": "INFO", "asctime": "2024-02-27 10:36:08,908", "deployment": "default_Model", "replica": "rdofcrh4", "message": "replica.py:855 - Started initializing replica."}
{"levelname": "INFO", "asctime": "2024-02-27 10:36:08,908", "deployment": "default_Model", "replica": "rdofcrh4", "message": "replica.py:877 - Finished initializing replica."}
{"levelname": "INFO", "asctime": "2024-02-27 10:36:10,127", "deployment": "default_Model", "replica": "rdofcrh4", "request_id": "f4f4b3c0-1cca-4424-9002-c887d7858525", "route": "/", "application": "default", "message": "replica.py:1068 - Started executing request to method '__call__'."}
{"levelname": "INFO", "asctime": "2024-02-27 10:36:10,127", "deployment": "default_Model", "replica": "rdofcrh4", "request_id": "f4f4b3c0-1cca-4424-9002-c887d7858525", "route": "/", "application": "default", "message": "replica.py:373 - __CALL__ OK 0.6ms"}
Disable access log#
Note
Access log is Ray Serve traffic log, it is printed to proxy log files and replica log files per request. Sometimes it is useful for debugging, but it can also be noisy.
You can also disable the access log by passing disable_access_log=True to logging_config argument of @serve.deployment. For example:
import requests
import logging
from ray import serve


@serve.deployment(logging_config={"enable_access_log": False})
class Model:
    def __call__(self):
        logger = logging.getLogger("ray.serve")
        logger.info("hello world")


serve.run(Model.bind())

resp = requests.get("http://localhost:8000/")
The Model replica log file doesn’t include the Serve traffic log, you should only see the application log in the log file.
# cat `ls /tmp/ray/session_latest/logs/serve/replica_default_Model_*`

INFO 2024-02-27 15:43:12,983 default_Model 4guj63jr replica.py:855 - Started initializing replica.
INFO 2024-02-27 15:43:12,984 default_Model 4guj63jr replica.py:877 - Finished initializing replica.
INFO 2024-02-27 15:43:13,492 default_Model 4guj63jr 2246c4bb-73dc-4524-bf37-c7746a6b3bba / <stdin>:5 - hello world
Configure logging in different deployments and applications#
You can also configure logging at the application level by passing logging_config to serve.run. For example:
import requests
import logging
from ray import serve


@serve.deployment
class Router:
    def __init__(self, handle):
        self.handle = handle

    async def __call__(self):
        logger = logging.getLogger("ray.serve")
        logger.debug("This debug message is from the router.")
        return await self.handle.remote()


@serve.deployment(logging_config={"log_level": "INFO"})
class Model:
    def __call__(self) -> int:
        logger = logging.getLogger("ray.serve")
        logger.debug("This debug message is from the model.")
        return "hello world"


serve.run(Router.bind(Model.bind()), logging_config={"log_level": "DEBUG"})
resp = requests.get("http://localhost:8000/")
In the Router log file, you should see the following:
# cat `ls /tmp/ray/session_latest/logs/serve/replica_default_Router_*`

INFO 2024-02-27 16:05:10,738 default_Router cwnihe65 replica.py:855 - Started initializing replica.
INFO 2024-02-27 16:05:10,739 default_Router cwnihe65 replica.py:877 - Finished initializing replica.
INFO 2024-02-27 16:05:11,233 default_Router cwnihe65 4db9445d-fc9e-490b-8bad-0a5e6bf30899 / replica.py:1068 - Started executing request to method '__call__'.
DEBUG 2024-02-27 16:05:11,234 default_Router cwnihe65 4db9445d-fc9e-490b-8bad-0a5e6bf30899 / <stdin>:7 - This debug message is from the router.
INFO 2024-02-27 16:05:11,238 default_Router cwnihe65 4db9445d-fc9e-490b-8bad-0a5e6bf30899 / router.py:308 - Using router <class 'ray.serve._private.replica_scheduler.pow_2_scheduler.PowerOfTwoChoicesReplicaScheduler'>.
DEBUG 2024-02-27 16:05:11,240 default_Router cwnihe65 long_poll.py:157 - LongPollClient <ray.serve._private.long_poll.LongPollClient object at 0x10daa5a80> received updates for keys: [(LongPollNamespace.DEPLOYMENT_CONFIG, DeploymentID(name='Model', app='default')), (LongPollNamespace.RUNNING_REPLICAS, DeploymentID(name='Model', app='default'))].
INFO 2024-02-27 16:05:11,241 default_Router cwnihe65 pow_2_scheduler.py:255 - Got updated replicas for deployment 'Model' in application 'default': {'default#Model#256v3hq4'}.
DEBUG 2024-02-27 16:05:11,241 default_Router cwnihe65 long_poll.py:157 - LongPollClient <ray.serve._private.long_poll.LongPollClient object at 0x10daa5900> received updates for keys: [(LongPollNamespace.DEPLOYMENT_CONFIG, DeploymentID(name='Model', app='default')), (LongPollNamespace.RUNNING_REPLICAS, DeploymentID(name='Model', app='default'))].
INFO 2024-02-27 16:05:11,245 default_Router cwnihe65 4db9445d-fc9e-490b-8bad-0a5e6bf30899 / replica.py:373 - __CALL__ OK 12.2ms
In the Model log file, you should see the following:
# cat `ls /tmp/ray/session_latest/logs/serve/replica_default_Model_*`

INFO 2024-02-27 16:05:10,735 default_Model 256v3hq4 replica.py:855 - Started initializing replica.
INFO 2024-02-27 16:05:10,735 default_Model 256v3hq4 replica.py:877 - Finished initializing replica.
INFO 2024-02-27 16:05:11,244 default_Model 256v3hq4 4db9445d-fc9e-490b-8bad-0a5e6bf30899 / replica.py:1068 - Started executing request to method '__call__'.
INFO 2024-02-27 16:05:11,244 default_Model 256v3hq4 4db9445d-fc9e-490b-8bad-0a5e6bf30899 / replica.py:373 - __CALL__ OK 0.6ms
When you set logging_config at the application level, Ray Serve applies to all deployments in the application. When you set logging_config at the deployment level at the same time, the deployment level configuration will overrides the application level configuration.
Configure logging for serve components#
You can also update logging configuration similar above to the Serve controller and proxies by passing logging_config to serve.start.
from ray import serve


serve.start(
    logging_config={
        "encoding": "JSON",
        "log_level": "DEBUG",
        "enable_access_log": False,
    }
)
Run custom initialization code in the controller#
For advanced use cases, you can run custom initialization code when the Serve Controller starts by setting the RAY_SERVE_CONTROLLER_CALLBACK_IMPORT_PATH environment variable. This variable should point to a callback function that runs during controller initialization. The function doesn’t need to return anything.
For example, to add a custom log handler:
# mymodule/callbacks.py
import logging

def setup_custom_logging():
    logger = logging.getLogger("ray.serve")
    handler = logging.StreamHandler()
    handler.setFormatter(logging.Formatter("[CUSTOM] %(message)s"))
    logger.addHandler(handler)
Then set the environment variable before starting Ray:
export RAY_SERVE_CONTROLLER_CALLBACK_IMPORT_PATH="mymodule.callbacks:setup_custom_logging"
Run custom initialization code in the HTTP proxy#
Similarly, you can run custom initialization code when the HTTP proxy starts by setting the RAY_SERVE_HTTP_PROXY_CALLBACK_IMPORT_PATH environment variable. This variable should point to a callback function that runs during HTTP proxy initialization. The function doesn’t need to return anything.
For example:
# mymodule/callbacks.py
import logging

def setup_proxy_logging():
    logger = logging.getLogger("ray.serve")
    handler = logging.StreamHandler()
    handler.setFormatter(logging.Formatter("[PROXY] %(message)s"))
    logger.addHandler(handler)
Then set the environment variable before starting Ray:
export RAY_SERVE_HTTP_PROXY_CALLBACK_IMPORT_PATH="mymodule.callbacks:setup_proxy_logging"
Configure slow startup warnings#
Ray Serve logs warnings when replicas take too long to start, helping you identify issues such as slow __init__ methods, long-running reconfigure methods, or resource scheduling delays. You can configure this warning behavior with the following environment variables:
RAY_SERVE_SLOW_STARTUP_WARNING_S: The time (in seconds) after which Ray Serve considers a replica to have a slow startup (defaults to30). If a replica takes longer than this to be scheduled or initialized, Ray Serve logs a warning.RAY_SERVE_SLOW_STARTUP_WARNING_PERIOD_S: The minimum interval (in seconds) between slow startup warning messages (defaults to30). This prevents log spam when multiple replicas start slowly.
Set Request ID#
You can set a custom request ID for each HTTP request by including X-Request-ID in the request header and retrieve request ID from response. For example
from ray import serve

import requests


@serve.deployment
class Model:
    def __call__(self) -> int:
        return 1


serve.run(Model.bind())
resp = requests.get("http://localhost:8000", headers={"X-Request-ID": "123-234"})

print(resp.headers["X-Request-ID"])
The custom request ID 123-234 can be seen in the access logs that are printed to the HTTP Proxy log files and deployment log files.
HTTP proxy log file:
INFO 2023-07-20 13:47:54,221 http_proxy 127.0.0.1 123-234 / default http_proxy.py:538 - GET 200 8.9ms
Deployment log file:
(ServeReplica:default_Model pid=84006) INFO 2023-07-20 13:47:54,218 default_Model default_Model#yptKoo 123-234 / default replica.py:691 - __CALL__ OK 0.2ms
Note
The request ID is used to associate logs across the system. Avoid sending duplicate request IDs, which may lead to confusion when debugging.
Filtering logs with Loki#
You can explore and filter your logs using Loki. Setup and configuration are straightforward on Kubernetes, but as a tutorial, let’s set up Loki manually.
For this walkthrough, you need both Loki and Promtail, which are both supported by Grafana Labs. Follow the installation instructions at Grafana’s website to get executables for Loki and Promtail. For convenience, save the Loki and Promtail executables in the same directory, and then navigate to this directory in your terminal.
Now let’s get your logs into Loki using Promtail.
Save the following file as promtail-local-config.yaml:
server:
  http_listen_port: 9080
  grpc_listen_port: 0

positions:
  filename: /tmp/positions.yaml

clients:
  - url: http://localhost:3100/loki/api/v1/push

scrape_configs:
  - job_name: ray
    static_configs:
      - labels:
        job: ray
        __path__: /tmp/ray/session_latest/logs/serve/*.*
The relevant part for Ray Serve is the static_configs field, where we have indicated the location of our log files with __path__. The expression *.* will match all files, but it won’t match directories since they cause an error with Promtail.
We’ll run Loki locally. Grab the default config file for Loki with the following command in your terminal:
wget https://raw.githubusercontent.com/grafana/loki/v2.1.0/cmd/loki/loki-local-config.yaml
Now start Loki:
./loki-darwin-amd64 -config.file=loki-local-config.yaml
Here you may need to replace ./loki-darwin-amd64 with the path to your Loki executable file, which may have a different name depending on your operating system.
Start Promtail and pass in the path to the config file we saved earlier:
./promtail-darwin-amd64 -config.file=promtail-local-config.yaml
Once again, you may need to replace ./promtail-darwin-amd64 with your Promtail executable.
Run the following Python script to deploy a basic Serve deployment with a Serve deployment logger and to make some requests:
from ray import serve

import logging
import requests

logger = logging.getLogger("ray.serve")


@serve.deployment
class Counter:
    def __init__(self):
        self.count = 0

    def __call__(self, request):
        self.count += 1
        logger.info(f"count: {self.count}")
        return {"count": self.count}


counter = Counter.bind()
serve.run(counter)

for i in range(10):
    requests.get("http://127.0.0.1:8000/")
Now install and run Grafana and navigate to http://localhost:3000, where you can log in with default credentials:
Username: admin
Password: admin
On the welcome page, click “Add your first data source” and click “Loki” to add Loki as a data source.
Now click “Explore” in the left-side panel. You are ready to run some queries!
To filter all these Ray logs for the ones relevant to our deployment, use the following LogQL query:
{job="ray"} |= "Counter"
You should see something similar to the following:
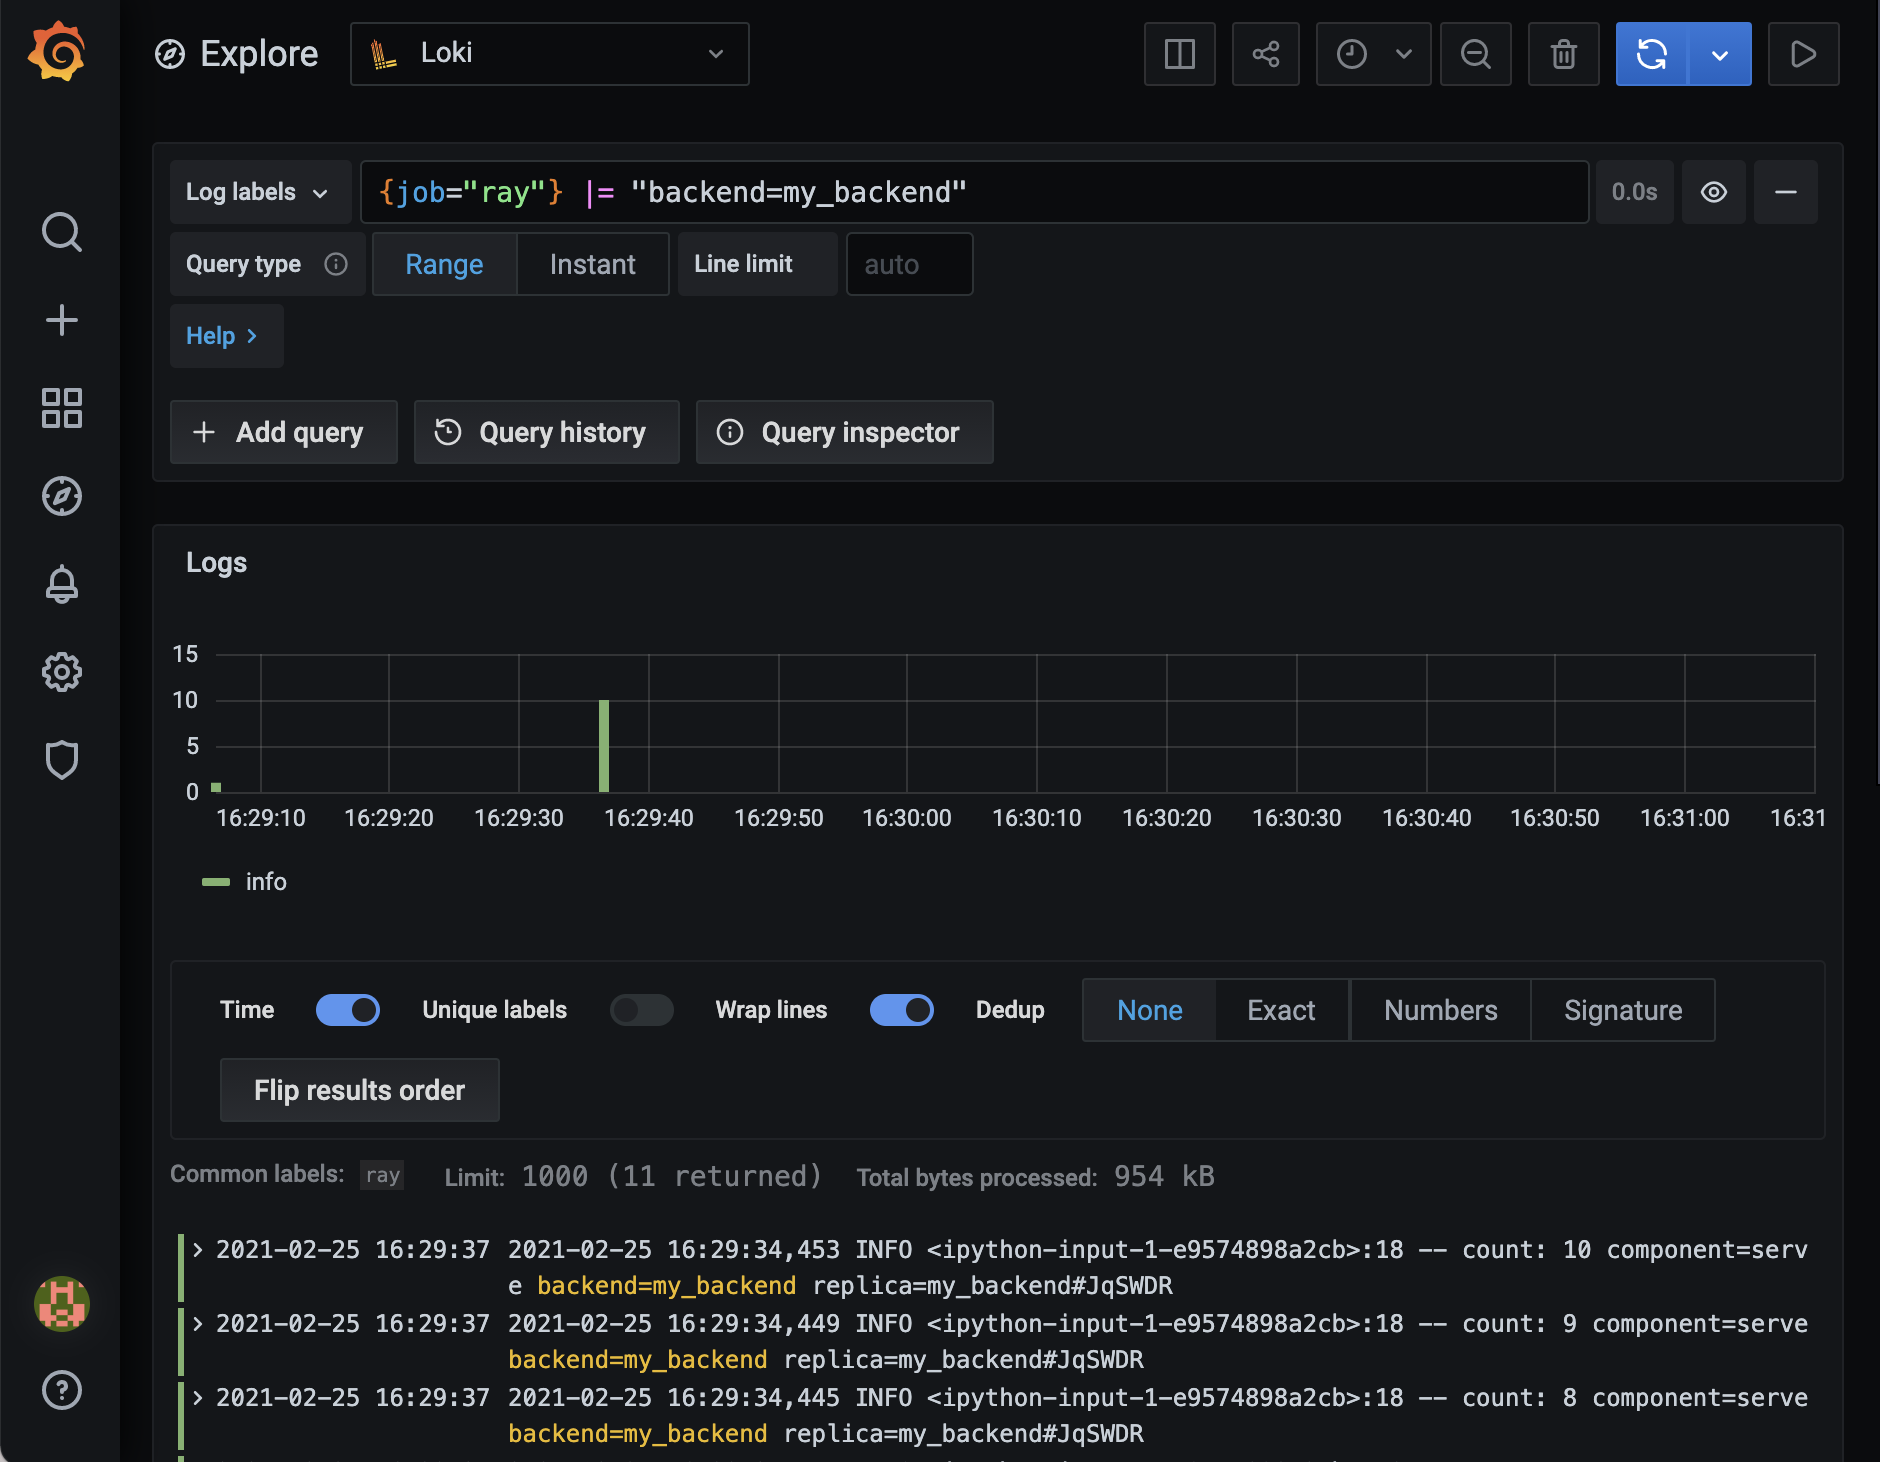
You can use Loki to filter your Ray Serve logs and gather insights quicker.
Built-in Ray Serve metrics#
Ray Serve exposes important system metrics like the number of successful and failed requests through the Ray metrics monitoring infrastructure. By default, metrics are exposed in Prometheus format on each node.
Note
Different metrics are collected when deployments are called via Python DeploymentHandle versus HTTP/gRPC. See the markers below each table:
[H] - Available when using HTTP/gRPC proxy calls
[D] - Available when using Python
DeploymentHandlecalls[†] - Internal metrics for advanced debugging; may change in future releases
Warning
Histogram bucket configuration
Histogram metrics use predefined bucket boundaries to aggregate latency measurements. The default buckets are: [1, 2, 5, 10, 20, 50, 100, 200, 300, 400, 500, 1000, 2000, 5000, 10000, 60000, 120000, 300000, 600000] (in milliseconds).
You can customize these buckets using environment variables:
RAY_SERVE_REQUEST_LATENCY_BUCKETS_MS: Controls bucket boundaries for request latency histograms:ray_serve_http_request_latency_msray_serve_grpc_request_latency_msray_serve_deployment_processing_latency_msray_serve_health_check_latency_msray_serve_replica_reconfigure_latency_ms
RAY_SERVE_MODEL_LOAD_LATENCY_BUCKETS_MS: Controls bucket boundaries for model multiplexing latency histograms:ray_serve_multiplexed_model_load_latency_msray_serve_multiplexed_model_unload_latency_ms
RAY_SERVE_BATCH_UTILIZATION_BUCKETS_PERCENT: Controls bucket boundaries for batch utilization histogram. Default:[5, 10, 20, 30, 40, 50, 60, 70, 80, 90, 95, 99, 100](percentage).ray_serve_batch_utilization_percent
RAY_SERVE_BATCH_SIZE_BUCKETS: Controls bucket boundaries for batch size histogram. Default:[1, 2, 4, 8, 16, 32, 64, 128, 256, 512, 1024].ray_serve_actual_batch_size
RAY_SERVE_REPLICA_STARTUP_SHUTDOWN_LATENCY_BUCKETS_MS: Controls bucket boundaries for replica lifecycle latency histograms:ray_serve_replica_startup_latency_msray_serve_replica_initialization_latency_msray_serve_replica_shutdown_duration_msray_serve_proxy_shutdown_duration_ms
Note: ray_serve_batch_wait_time_ms and ray_serve_batch_execution_time_ms use the same buckets as RAY_SERVE_REQUEST_LATENCY_BUCKETS_MS.
Set these as comma-separated values, for example: RAY_SERVE_REQUEST_LATENCY_BUCKETS_MS="10,50,100,500,1000,5000" or RAY_SERVE_BATCH_SIZE_BUCKETS="1,4,8,16,32,64".
Histogram accuracy considerations
Prometheus histograms aggregate data into predefined buckets, which can affect the accuracy of percentile calculations (e.g., p50, p95, p99) displayed on dashboards:
Values outside bucket range: If your latencies exceed the largest bucket boundary (default: 600,000ms / 10 minutes), they all fall into the
+Infbucket and percentile estimates become inaccurate.Sparse bucket coverage: If your actual latencies cluster between two widely-spaced buckets, the calculated percentiles are interpolated and may not reflect true values.
Bucket boundaries are fixed at startup: Changes to bucket environment variables (such as
RAY_SERVE_REQUEST_LATENCY_BUCKETS_MS,RAY_SERVE_BATCH_SIZE_BUCKETS, etc.) require restarting Serve actors to take effect.
For accurate percentile calculations, configure bucket boundaries that closely match your expected latency distribution. For example, if most requests complete in 10-100ms, use finer-grained buckets in that range.
Metrics export interval#
By default, Ray Serve batches its in-process metric updates (counters, gauges, histograms recorded by the router and replica) to reduce per-request overhead. You can configure how often Serve flushes these batched updates to the Ray metrics API using the RAY_SERVE_METRICS_EXPORT_INTERVAL_MS environment variable:
export RAY_SERVE_METRICS_EXPORT_INTERVAL_MS=500
Default: 100 milliseconds. Set to 0 to disable batching entirely and record every metric update eagerly. This interval applies to both the router and replica metric pipelines.
Increasing this value reduces the overhead of recording metrics at the cost of less frequent updates. Decreasing it provides more up-to-date values but increases recording frequency.
Note
RAY_SERVE_METRICS_EXPORT_INTERVAL_MS only controls Serve-side batching; it does not change how often Ray exports metrics to the Prometheus scrape endpoint. That is controlled separately by Ray Core’s metrics_report_interval_ms system config (default 10000 ms), which determines how often each Ray process pushes its metrics to the metrics agent that Prometheus scrapes.
The two settings compose: a Serve metric update is first buffered in the router/replica for up to RAY_SERVE_METRICS_EXPORT_INTERVAL_MS, then made available at the Prometheus endpoint on the next Ray Core export tick (metrics_report_interval_ms). Lowering only RAY_SERVE_METRICS_EXPORT_INTERVAL_MS without also lowering metrics_report_interval_ms does not make metrics appear in Prometheus any sooner. To change the Ray Core interval, pass it via system config when starting Ray, e.g. ray start --head --system-config='{"metrics_report_interval_ms": 1000}'.
Request lifecycle and metrics#
The following diagram shows where metrics are captured along the request path:
                                    REQUEST FLOW
  ┌─────────────────────────────────────────────────────────────────────────────┐
  │                                                                             │
  │   ┌─────────────────────────────────────────────────────────────────────┐   │
  │   │                        HTTP/gRPC PROXY                              │   │
  │   │                                                                     │   │
  │   │  ○ ray_serve_num_ongoing_http_requests      (while processing)      │   │
  │   │  ○ ray_serve_num_http_requests_total        (on completion)         │   │
  │   │  ○ ray_serve_http_request_latency_ms        (on completion)         │   │
  │   │  ○ ray_serve_num_http_error_requests_total  (on error response)     │   │
  │   └──────────────────────────────┬──────────────────────────────────────┘   │
  │                                  │                                          │
  │                                  ▼                                          │
  │   ┌─────────────────────────────────────────────────────────────────────┐   │
  │   │                      DEPLOYMENT HANDLE                              │   │
  │   │                                                                     │   │
  │   │  ○ ray_serve_handle_request_counter_total   (on completion)         │   │
  │   └──────────────────────────────┬──────────────────────────────────────┘   │
  │                                  │                                          │
  │                                  ▼                                          │
  │   ┌─────────────────────────────────────────────────────────────────────┐   │
  │   │                           ROUTER                                    │   │
  │   │                                                                     │   │
  │   │  ○ ray_serve_num_router_requests_total      (on request routed)     │   │
  │   │  ○ ray_serve_deployment_queued_queries      (while in queue)        │   │
  │   │  ○ ray_serve_num_ongoing_requests_at_replicas (assigned to replica) │   │
  │   └──────────────────────────────┬──────────────────────────────────────┘   │
  │                                  │                                          │
  │                                  ▼                                          │
  │   ┌─────────────────────────────────────────────────────────────────────┐   │
  │   │                          REPLICA                                    │   │
  │   │                                                                     │   │
  │   │  ○ ray_serve_replica_processing_queries     (while processing)      │   │
  │   │  ○ ray_serve_deployment_processing_latency_ms (on completion)       │   │
  │   │  ○ ray_serve_deployment_request_counter_total (on completion)       │   │
  │   │  ○ ray_serve_deployment_error_counter_total   (on exception)        │   │
  │   │  ○ ray_serve_deployment_max_processing_latency_ms (rolling max)     │   │
  │   └─────────────────────────────────────────────────────────────────────┘   │
  │                                                                             │
  └─────────────────────────────────────────────────────────────────────────────┘

  Legend:
  ─────────────────────────────────────────────────────────────────────────────
  • Counters (_total): Incremented once per event
  • Gauges (ongoing/queued): Show current count, increase on start, decrease on end
  • Histograms (latency_ms): Record duration when request completes
HTTP/gRPC proxy metrics#
These metrics track request throughput and latency at the proxy level (request entry point).
Metric |
Type |
Tags |
Description |
|---|---|---|---|
|
Gauge |
|
Current number of HTTP requests being processed by the proxy. |
|
Gauge |
|
Current number of gRPC requests being processed by the proxy. |
|
Counter |
|
Total number of HTTP requests processed by the proxy. |
|
Counter |
|
Total number of gRPC requests processed by the proxy. |
|
Histogram |
|
Histogram of end-to-end HTTP request latency in milliseconds (measured from proxy receipt to response sent). |
|
Histogram |
|
Histogram of end-to-end gRPC request latency in milliseconds (measured from proxy receipt to response sent). |
|
Counter |
|
Total number of HTTP requests that returned non-2xx/3xx status codes. |
|
Counter |
|
Total number of gRPC requests that returned non-OK status codes. |
|
Counter |
|
Total number of HTTP errors per deployment. Useful for identifying which deployment caused errors. |
|
Counter |
|
Total number of gRPC errors per deployment. Useful for identifying which deployment caused errors. |
Request routing metrics#
These metrics track request routing and queueing behavior.
Metric |
Type |
Tags |
Description |
|---|---|---|---|
|
Counter |
|
Total number of requests processed by this |
|
Counter |
|
Total number of requests routed to a deployment. |
|
Gauge |
|
Current number of requests waiting to be assigned to a replica. High values indicate backpressure. |
|
Gauge |
|
Current number of requests assigned and sent to replicas but not yet completed. |
|
Histogram |
|
Histogram of time in milliseconds that a request spent waiting in the router queue before being assigned to a replica. This includes the time to resolve the pending request’s arguments. |
|
Gauge |
|
Current number of requests running on a replica as tracked by the router’s queue length cache. |
|
Gauge |
|
Current number of request scheduling tasks in the router. |
|
Gauge |
|
Current number of scheduling tasks in exponential backoff (waiting before retry). |
|
Histogram |
|
Time in milliseconds spent resolving upstream |
Request processing metrics#
These metrics track request throughput, errors, and latency at the replica level.
Metric |
Type |
Tags |
Description |
|---|---|---|---|
|
Gauge |
|
Current number of requests being processed by the replica. |
|
Gauge |
|
Percentage of replica capacity used over a rolling window. Calculated as total user code execution time divided by maximum capacity ( |
|
Counter |
|
Total number of requests processed by the replica. |
|
Histogram |
|
Histogram of request processing time in milliseconds (excludes queue wait time). |
|
Counter |
|
Total number of exceptions raised while processing requests. |
|
Gauge |
|
Maximum request processing time in milliseconds over a rolling window. Tracks the highest latency observed per route across a configurable time window, reported periodically. Configure with |
Batching metrics#
These metrics track request batching behavior for deployments using @serve.batch. Use them to tune batching parameters and debug latency issues.
Metric |
Type |
Tags |
Description |
|---|---|---|---|
|
Histogram |
|
Time requests waited for the batch to fill in milliseconds. High values indicate batch timeout may be too long. |
|
Histogram |
|
Time to execute the batch function in milliseconds. |
|
Gauge |
|
Current number of requests waiting in the batch queue. High values indicate a batching bottleneck. |
|
Histogram |
|
Batch utilization as percentage ( |
|
Histogram |
|
The computed size of each batch. When |
|
Counter |
|
Total number of batches executed. Compare with request counter to measure batching efficiency. |
Proxy health metrics#
These metrics track proxy health and lifecycle.
Metric |
Type |
Tags |
Description |
|---|---|---|---|
|
Gauge |
|
Current status of the proxy as a numeric value: |
|
Histogram |
|
Time taken for a proxy to shut down in milliseconds. |
HAProxy system metrics#
These node-level gauges observe the health of Serve’s HAProxy proxy process on each node. They are sampled on a periodic poll loop and emitted whenever the HAProxy proxy is enabled (RAY_SERVE_ENABLE_HA_PROXY=1) with HAProxy metrics enabled (RAY_SERVE_HAPROXY_METRICS_ENABLED, on by default). The sampling interval is controlled by RAY_SERVE_HAPROXY_METRICS_REPORT_INTERVAL_S (default: 10s).
Metric |
Type |
Tags |
Description |
|---|---|---|---|
|
Gauge |
|
Number of HAProxy processes running on the node for this proxy, spanning the live worker, draining workers from prior reloads, and any leaked or orphaned workers. A value persistently above |
|
Gauge |
|
Number of targets that differ between the controller’s broadcasted target set and the targets HAProxy actually reports in its stats on this node (symmetric set difference). A non-zero value means the HAProxy config has not yet converged to the broadcasted targets. |
HAProxy ingress request router metrics#
These metrics observe the ingress request router data path used by Serve’s HAProxy proxy when a deployment opts in (e.g. the LLM ingress with LLMRouter). For each request that reaches a router-bearing app, HAProxy calls the router’s /internal/route endpoint to pick a replica before forwarding traffic to it. The metrics below cover that consultation.
To enable the feature, set RAY_SERVE_INGRESS_REQUEST_ROUTER_METRICS_ENABLED=1. The socket path defaults to /tmp/haproxy-serve/<node_id>/metrics.sock and can be overridden with RAY_SERVE_HAPROXY_METRICS_SOCKET_PATH.
Metric |
Type |
Tags |
Description |
|---|---|---|---|
|
Histogram |
|
Wall-clock time HAProxy spent consulting the ingress request router (measured around the Lua socket call). Buckets cover 0.5 ms to 1 s. Use to detect router-side slowdowns before they show up in end-to-end p99. The |
|
Counter |
|
Total number of requests processed by the ingress request router, including both successes and failures. |
|
Counter |
|
Number of requests whose body was clipped by HAProxy’s |
|
Counter |
|
Number of requests where HAProxy ultimately routed to a different replica than the router returned. This happens when the named replica is |
|
Counter |
|
Number of router consultations that failed to pin a replica. Each failure causes HAProxy to return |
HAProxy config reload metrics#
This metric tracks how long it takes for a controller update (replica set or fallback-target change) to take effect in HAProxy when using Serve’s HAProxy proxy.
Metric |
Type |
Tags |
Description |
|---|---|---|---|
|
Histogram |
|
Seconds from the first coalesced controller broadcast to the HAProxy reload completing. Includes the coalesce window ( |
Replica lifecycle metrics#
These metrics track replica health, restarts, and lifecycle timing.
Note
These lifecycle histograms use deployment and application labels only—no replica label—so Prometheus cardinality stays manageable at scale.
By default, controller-emitted replica lifecycle metrics include source
identifiers such as replica where applicable. For large deployments, set
RAY_SERVE_CONTROLLER_METRICS_INCLUDE_HIGH_CARDINALITY_TAGS=0 to drop those
source-level high-cardinality tags while retaining deployment and application.
This setting doesn’t affect replica-emitted metrics such as
ray_serve_deployment_replica_starts_total.
Metric |
Type |
Tags |
Description |
|---|---|---|---|
|
Gauge |
|
Tracks healthy replicas. With |
|
Counter |
|
Total number of times the replica has started (including restarts due to failure). |
|
Histogram |
|
Total time from replica creation to ready state in milliseconds. Includes node provisioning (if needed on VM or Kubernetes), runtime environment bootstrap (pip install, Docker image pull, etc.), Ray actor scheduling, and actor constructor execution. Useful for debugging slow cold starts. |
|
Histogram |
|
Time for the actor constructor to run in milliseconds. This is a subset of |
|
Histogram |
|
Time in milliseconds for a replica to complete reconfiguration. Includes both reconfigure time and one control-loop iteration, so very low values may be unreliable. |
|
Histogram |
|
Duration of health check calls in milliseconds. Useful for identifying slow health checks blocking scaling. |
|
Counter |
|
Total number of failed health checks. Provides early warning before replica is marked unhealthy. |
|
Histogram |
|
Time from shutdown signal to replica fully stopped in milliseconds. Useful for debugging slow draining during scale-down or rolling updates. |
Autoscaling metrics#
These metrics provide visibility into autoscaling behavior and help debug scaling issues.
The autoscaling delay metrics ray_serve_autoscaling_replica_metrics_delay_ms
and ray_serve_autoscaling_handle_metrics_delay_ms are histograms labeled
only by deployment and application. Prometheus aggregates the per-replica
and per-handle observations server-side, so no source-level tag is emitted and
cardinality stays bounded at scale.
Metric |
Type |
Tags |
Description |
|---|---|---|---|
|
Gauge |
|
Target number of replicas the autoscaler is trying to reach. Compare with actual replicas to identify scaling lag. |
|
Gauge |
|
Raw autoscaling decision (number of replicas) from the policy before applying |
|
Gauge |
|
Total number of requests (queued + in-flight) as seen by the autoscaler. This is the input to the scaling decision. |
|
Gauge |
|
Configured |
|
Gauge |
|
Time taken to execute the autoscaling policy in milliseconds. |
|
Histogram |
|
Time taken for replica metrics to reach the controller in milliseconds. High values may indicate controller overload. |
|
Histogram |
|
Time taken for handle metrics to reach the controller in milliseconds. High values may indicate controller overload. |
|
Gauge |
|
Time taken for async inference task queue metrics (from QueueMonitor) to reach the controller in milliseconds. |
|
Counter |
|
Total number of failed attempts to collect autoscaling metrics on replica from user defined function. Non-zero values indicate error in user code. |
|
Histogram |
|
Histogram of time taken to execute the user-defined autoscaling stats function in milliseconds. |
Model multiplexing metrics#
These metrics track model loading and caching behavior for deployments using @serve.multiplexed.
Metric |
Type |
Tags |
Description |
|---|---|---|---|
|
Histogram |
|
Histogram of time taken to load a model in milliseconds. |
|
Histogram |
|
Histogram of time taken to unload a model in milliseconds. |
|
Gauge |
|
Current number of models loaded on the replica. |
|
Counter |
|
Total number of model load operations. |
|
Counter |
|
Total number of model unload operations (evictions). |
|
Gauge |
|
Indicates which model IDs are currently loaded. Value is |
|
Counter |
|
Total number of |
Controller metrics#
These metrics track the Serve controller’s performance. Useful for debugging control plane issues.
Metric |
Type |
Tags |
Description |
|---|---|---|---|
|
Gauge |
— |
Duration of the last control loop iteration in seconds. |
|
Gauge |
|
Total number of control loop iterations. Increases monotonically. |
|
Histogram |
|
Time taken for routing stats to propagate from replica to controller in milliseconds. |
|
Counter |
|
Total number of errors when getting routing stats from replicas. |
|
Counter |
|
Total number of long poll updates transmitted to clients. |
|
Gauge |
|
Numeric status of deployment: |
|
Gauge |
|
Numeric status of application: |
|
Histogram |
|
Time for updates to propagate from controller to clients in milliseconds. |
|
Gauge |
|
Number of clients waiting for updates. |
Event loop monitoring metrics#
These metrics track the health of asyncio event loops in Serve components. High scheduling latency indicates the event loop is blocked, which can cause request latency issues. Use these metrics to detect blocking code in handlers or system bottlenecks.
Metric |
Type |
Tags |
Description |
|---|---|---|---|
|
Histogram |
|
Event loop scheduling delay in milliseconds. Measures how long the loop was blocked beyond the expected sleep interval. Values close to zero indicate a healthy loop; high values indicate either blocking code or a large number of tasks queued on the event loop. |
|
Counter |
|
Number of event loop monitoring iterations. Acts as a heartbeat; a stalled counter indicates the loop is completely blocked. |
|
Gauge |
|
Number of pending asyncio tasks on the event loop. High values may indicate task accumulation. |
* deployment and application tags are only present for replica main and user_code loops, not for proxy or router loops.
Tag values:
component: The Serve component type.proxy: HTTP/gRPC proxy actorreplica: Deployment replica actorunknown: When usingDeploymentHandle.remote()
loop_type: The type of event loop being monitored.main: Main event loop for the actor (always present)user_code: Separate event loop for user handler code (replicas only, whenRAY_SERVE_RUN_USER_CODE_IN_SEPARATE_THREAD=1, which is the default)router: Separate event loop for request routing (replicas only, whenRAY_SERVE_RUN_ROUTER_IN_SEPARATE_LOOP=1, which is the default)
actor_id: The Ray actor ID of the proxy or replicadeployment: The deployment name (replicas only, formainanduser_codeloops)application: The application name (replicas only, formainanduser_codeloops)
Interpreting scheduling latency:
< 10ms: Healthy event loop
10-50ms: Acceptable under load
50-100ms: Concerning; investigate for blocking code
100-500ms: Problematic; likely blocking I/O or CPU-bound code in async handlers
> 500ms: Severe blocking; definitely impacting request latency
To see this in action, first run the following command to start Ray and set up the metrics export port:
ray start --head --metrics-export-port=8080
Then run the following script:
from ray import serve

import time
import requests


@serve.deployment
def sleeper():
    time.sleep(1)


s = sleeper.bind()

serve.run(s)

while True:
    requests.get("http://localhost:8000/")
The requests loop until canceled with Control-C.
While this script is running, go to localhost:8080 in your web browser. In the output there, you can search for serve_ to locate the metrics above. The metrics are updated once every ten seconds by default, so you need to refresh the page to see new values. The metrics report interval rate can be modified using the following configuration option (note that this is not a stable public API and is subject to change without warning):
ray start --head --system-config='{"metrics_report_interval_ms": 1000}'
For example, after running the script for some time and refreshing localhost:8080 you should find metrics similar to the following:
ray_serve_deployment_processing_latency_ms_count{..., replica="sleeper#jtzqhX"} 48.0
ray_serve_deployment_processing_latency_ms_sum{..., replica="sleeper#jtzqhX"} 48160.6719493866
which indicates that the average processing latency is just over one second, as expected.
You can even define a custom metric for your deployment and tag it with deployment or replica metadata. Here’s an example:
from ray import serve
from ray.serve import metrics

import time
import requests


@serve.deployment
class MyDeployment:
    def __init__(self):
        self.num_requests = 0
        self.my_counter = metrics.Counter(
            "my_counter",
            description=("The number of odd-numbered requests to this deployment."),
            tag_keys=("model",),
        )
        self.my_counter.set_default_tags({"model": "123"})

    def __call__(self):
        self.num_requests += 1
        if self.num_requests % 2 == 1:
            self.my_counter.inc()


my_deployment = MyDeployment.bind()
serve.run(my_deployment)

while True:
    requests.get("http://localhost:8000/")
    time.sleep(1)
The emitted logs include:
# HELP ray_my_counter_total The number of odd-numbered requests to this deployment.
# TYPE ray_my_counter_total counter
ray_my_counter_total{..., deployment="MyDeployment",model="123",replica="MyDeployment#rUVqKh"} 5.0
See the Ray Metrics documentation for more details, including instructions for scraping these metrics using Prometheus.
Profiling memory#
Ray provides two useful metrics to track memory usage: ray_component_rss_bytes (resident set size) and ray_component_shared_bytes (shared memory). Approximate a Serve actor’s memory usage by subtracting its shared memory from its resident set size (i.e. ray_component_rss_bytes - ray_component_shared_bytes). Note: ray_component_rss_mb is being deprecated, please use ray_component_rss_bytes going forward.
If you notice a memory leak on a Serve actor, use memray to debug (pip install memray). Set the env var RAY_SERVE_ENABLE_MEMORY_PROFILING=1, and run your Serve application. All the Serve actors will run a memray tracker that logs their memory usage to bin files in the /tmp/ray/session_latest/logs/serve/ directory. Run the memray flamegraph [bin file] command to generate a flamegraph of the memory usage. See the memray docs for more info.
Exporting metrics into Arize#
Besides using Prometheus to check out Ray metrics, Ray Serve also has the flexibility to export the metrics into other observability platforms.
Arize is a machine learning observability platform which can help you to monitor real-time model performance, root cause model failures/performance degradation using explainability & slice analysis and surface drift, data quality, data consistency issues etc.
To integrate with Arize, add Arize client code directly into your Serve deployment code. (Example code)