Persist KubeRay Operator Logs#
The KubeRay Operator plays a vital role in managing Ray clusters on Kubernetes. Persisting its logs is essential for effective troubleshooting and monitoring. This guide describes methods to set up centralized logging for KubeRay Operator logs.
Grafana Loki#
Grafana Loki is a log aggregation system optimized for Kubernetes, providing efficient log storage and querying. The following steps set up Fluent Bit as a DaemonSet to collect logs from Kubernetes containers and send them to Loki for centralized storage and analysis.
Deploy Loki monolithic mode#
Loki’s Helm chart supports three deployment methods to fit different scalability and performance needs: Monolithic, Simple Scalable, and Microservices. This guide demonstrates the monolithic method. For details on each deployment mode, see the Loki deployment modes documentation.
Deploy the Loki deployment with the Helm chart repository.
helm repo add grafana https://grafana.github.io/helm-charts
helm repo update

# Install Loki with single replica mode
helm install loki grafana/loki --version 6.21.0 -f https://raw.githubusercontent.com/grafana/loki/refs/heads/main/production/helm/loki/single-binary-values.yaml
Configure log processing#
Create a fluent-bit-config.yaml file, which configures Fluent Bit to:
Tail log files from Kubernetes containers.
Parse multi-line logs for Docker and Container Runtime Interface (CRI) formats.
Enrich logs with Kubernetes metadata such as namespace, pod, and container names.
Send the logs to Loki for centralized storage and querying.
config:
  inputs: |
    [INPUT]
        Name tail
        Path /var/log/containers/*.log
        multiline.parser docker, cri
        Tag kube.*
        Mem_Buf_Limit 5MB
        Skip_Long_Lines On

  filters: |
    [FILTER]
        Name kubernetes
        Match kube.*
        Merge_Log On
        Keep_Log Off
        K8S-Logging.Parser On
        K8S-Logging.Exclude On

  outputs: |
    [OUTPUT]
        Name loki
        Match *
        Host loki-gateway
        Port 80
        Labels job=fluent-bit,namespace=$kubernetes['namespace_name'],pod=$kubernetes['pod_name'],container=$kubernetes['container_name']
        Auto_Kubernetes_Labels Off
        tenant_id test
A few notes on the above config:
Inputs: The
tailinput reads log files from/var/log/containers/*.log, withmultiline.parserto handle complex log messages across multiple lines.Filters: The
kubernetesfilter adds metadata like namespace, pod, and container names to each log, enabling more efficient log management and querying in Loki.Outputs: The
lokioutput block specifies Loki as the target. TheHostandPortdefine the Loki service endpoint, andLabelsadds metadata for easier querying in Grafana. Additionally,tenant_idallows for multi-tenancy if required by the Loki setup.
Deploy the Fluent Bit deployment with the Helm chart repository.
helm repo add fluent https://fluent.github.io/helm-charts
helm repo update

helm install fluent-bit fluent/fluent-bit --version 0.48.2 -f fluent-bit-config.yaml
Install the KubeRay Operator#
Follow Deploy a KubeRay operator to install the KubeRay operator.
Deploy a RayCluster#
Follow Deploy a RayCluster custom resource to deploy a RayCluster.
Deploy Grafana#
Create a datasource-config.yaml file with the following configuration to set up Grafana’s Loki datasource:
datasources:
  datasources.yaml:
    apiVersion: 1
    datasources:
      - name: Loki
        type: loki
        access: proxy
        editable: true
        url: http://loki-gateway.default
        jsonData:
          timeout: 60
          maxLines: 1000
          httpHeaderName1: "X-Scope-OrgID"
        secureJsonData:
          httpHeaderValue1: "test"
Deploy the Grafana deployment with the Helm chart repository.
helm repo add grafana https://grafana.github.io/helm-charts
helm repo update

helm install grafana grafana/grafana --version 8.6.2 -f datasource-config.yaml
Check the Grafana Dashboard#
# Verify that the Grafana pod is running in the `default` namespace.
kubectl get pods --namespace default -l "app.kubernetes.io/name=grafana"
# NAME                       READY   STATUS    RESTARTS   AGE
# grafana-54d5d747fd-5fldc   1/1     Running   0          8m21s
To access Grafana from your local machine, set up port forwarding by running:
export POD_NAME=$(kubectl get pods --namespace default -l "app.kubernetes.io/name=grafana,app.kubernetes.io/instance=grafana" -o jsonpath="{.items[0].metadata.name}")
kubectl --namespace default port-forward $POD_NAME 3000
This command makes Grafana available locally at http://localhost:3000.
Username: “admin”
Password: Get the password using the following command:
kubectl get secret --namespace default grafana -o jsonpath="{.data.admin-password}" | base64 --decode ; echo
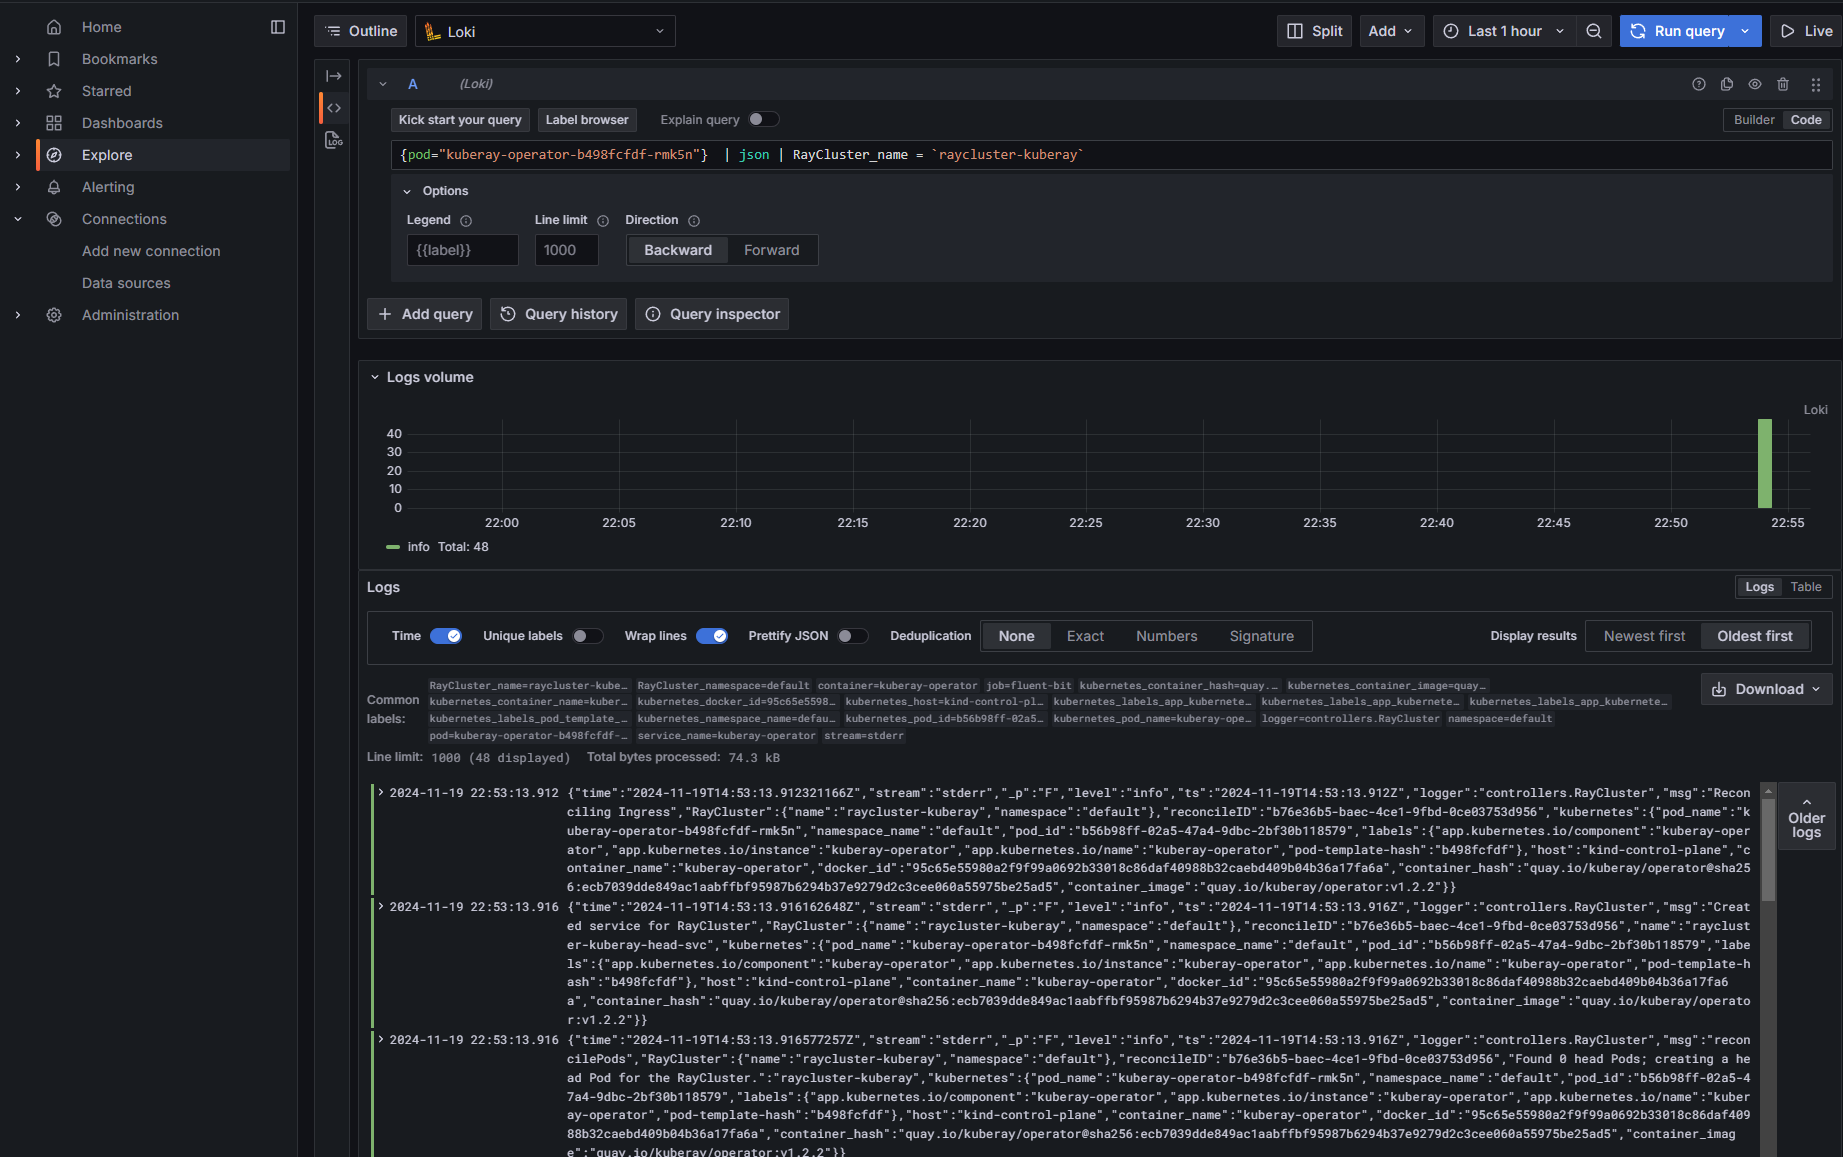
Finally, use a LogQL query to view logs for a specific pod, such as the KubeRay Operator, and filter logs by the RayCluster_name:
{pod="kuberay-operator-xxxxxxxx-xxxxx"} | json | RayCluster_name = `raycluster-kuberay`

You can use LogQL’s JSON syntax to filter logs based on specific fields, such as RayCluster_name. See Log query language doc for more information about LogQL filtering.