MetricsLogger API#
Use MetricsLogger to track metrics across RLlib experiments. Most RLlib components keep an instance of MetricsLogger to log to, such as EnvRunner and Learner. RLlib aggregates logged metrics toward the root MetricsLogger, which lives inside the Algorithm object and reports metrics to you or to Ray Tune. When a subcomponent reports metrics down the hierarchy, it “reduces” the logged results before sending them. For example, when reducing by summation, subcomponents calculate sums before sending them to the parent component.
Use this API for any metrics that you want RLlib to report, especially metrics that should reach Ray Tune or WandB. To see how RLlib uses MetricsLogger, look at EnvRunner-based callbacks, a custom loss function, or a custom training_step implementation.
To communicate data between RLlib components, such as a loss from Learners to EnvRunners, pass those values through callbacks or by overriding RLlib components’ attributes. MetricsLogger aggregates metrics. It doesn’t make them available everywhere at any time, so querying logged metrics from it can lead to unexpected results.
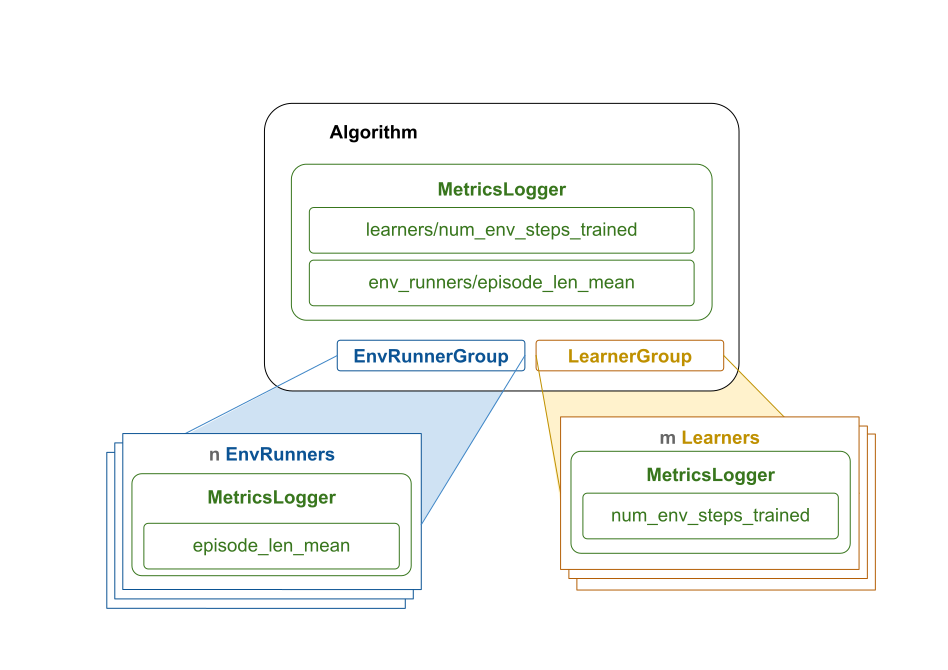
RLlib’s MetricsLogger aggregation overview: The diagram shows how RLlib aggregates metrics logged in parallel components toward the root MetricsLogger. Parallel subcomponents of Algorithm have their own MetricsLogger instance and use it to log values locally. When a subcomponent such as an EnvRunner or Learner completes a distinct task, for example an EnvRunner finishing a sampling request, RLlib “reduces” its local metrics and sends them downstream toward the root Algorithm component. The parent component merges the received results into its own MetricsLogger. Once Algorithm completes its own cycle, when step() returns, it “reduces” as well for final reporting to you or to Ray Tune.
Features of MetricsLogger#
The MetricsLogger API offers the following capabilities:
Log scalar values over time, such as losses, individual rewards, or episode returns.
Configure reduction types, such as
ema,mean,min,max, orsum. To skip reduction, useitemoritem_series, which leave the logged values untouched.Specify sliding windows for reductions, such as
window=100to average over the last 100 logged values per parallel component. Alternatively, specify exponential moving average (EMA) coefficients.Log execution times for distinct code blocks with a
with MetricsLogger.log_time(...)block.Add up lifetime sums by setting
reduce="lifetime_sum"when logging values.For sums and lifetime sums, you can also compute the corresponding per-second throughput metrics.
Built-in usages of MetricsLogger#
RLlib uses the MetricsLogger API extensively across its codebase. The following steps show a typical information flow:
The
Algorithmsends parallel sample requests to itsnEnvRunneractors.Each
EnvRunnercollects training data by stepping through its RL environment and logs standard stats to itsMetricsLogger, such as episode return or episode length.Each
EnvRunnerreduces all collected metrics and returns them to the Algorithm.The
Algorithmaggregates thenchunks of metrics from the EnvRunners. The aggregation depends on the chosen reduce method, such as averaging whenreduce="mean".The
Algorithmsends parallel update requests to itsmLearneractors.Each
Learnerperforms a model update while logging metrics to itsMetricsLogger, such as total loss or mean gradients.Each
Learnerreduces all collected metrics and returns them to the Algorithm.The
Algorithmaggregates themchunks of metrics from the Learners. The aggregation again depends on the chosen reduce method, such as summing whenreduce="sum".The
Algorithmmay add standard metrics to its ownMetricsLoggerinstance, for example the average time of a parallel sample request.The
Algorithmreduces all collected metrics and returns them to you or Ray Tune.
The MetricsLogger APIs in detail#
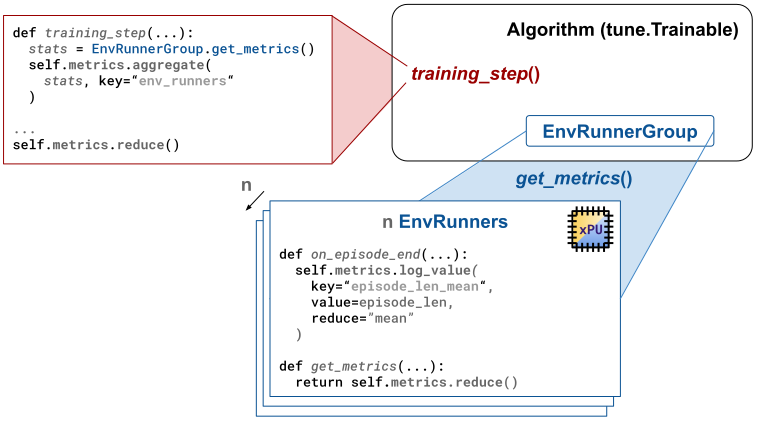
RLlib’s MetricsLogger API: This diagram shows how RLlib uses the MetricsLogger API to log and aggregate metrics. RLlib logs metrics with the log_time() and log_value() methods. It then reduces the metrics with reduce() and aggregates the reduced metrics with aggregate(). Finally, the Algorithm object reduces all metrics to report them to you or Ray Tune.
Logging scalar values#
To log a scalar value under some string key in your MetricsLogger, use the log_value() method:
from ray.rllib.utils.metrics.metrics_logger import MetricsLogger

logger = MetricsLogger()

# Log a scalar float value under the `loss` key. By default, all logged
# values under that key are averaged, once `reduce()` is called.
logger.log_value("loss", 0.01, reduce="mean", window=2)
By default, MetricsLogger reduces values by averaging them with reduce="mean".
Find other available reduction methods in the ray.rllib.utils.metrics.metrics_logger.DEFAULT_STATS_CLS_LOOKUP dictionary.
Note
You can also provide your own reduction methods by extending ray.rllib.utils.metrics.metrics_logger.DEFAULT_STATS_CLS_LOOKUP and passing it to reporting(). Each reduction method is then available by its key when you log values at runtime. For example, extend the dictionary with a key "my_custom_reduce_method", pass it to reporting(), and use reduce="my_custom_reduce_method" when logging.
Specifying a window causes the reduction to take place over the last window logged values. For example, continue logging values under the loss key:
logger.log_value("loss", 0.02, reduce="mean", window=2)
logger.log_value("loss", 0.03, reduce="mean", window=2)
logger.log_value("loss", 0.04, reduce="mean", window=2)
logger.log_value("loss", 0.05, reduce="mean", window=2)
Because you specified a window of 2, MetricsLogger uses only the last two values to compute the reduced result. Use the peek() method to peek() at the current reduced result:
# Peek at the current, reduced value.
# Note that in the underlying structure, the internal values list still
# contains all logged values: 0.01, 0.02, 0.03, 0.04, and 0.05.
print(logger.peek("loss"))  # Expect: 0.045, which is the average over the last 2 values
The peek() method checks the current underlying reduced result for a key without calling reduce().
Warning
You often cannot meaningfully peek metrics that RLlib aggregates downstream. For example, if you log the number of steps you trained on each call to update(), the Algorithm’s MetricsLogger reduces and aggregates those values, so peeking them inside Learner does not give you the aggregated result.
Instead of a flat key, you can log a value under a nested key by passing a tuple:
# Log a value under a deeper nested key.
logger.log_value(("some", "nested", "key"), -1.0)
print(logger.peek(("some", "nested", "key")))  # expect: -1.0
To use a reduce method other than mean, specify the reduce argument in log_value():
# Log a maximum value.
logger.log_value(key="max_value", value=0.0, reduce="max")
RLlib resets the maximum value after each reduce() operation.
for i in range(1000, 0, -1):
    logger.log_value(key="max_value", value=float(i))

logger.peek("max_value")  # Expect: 1000.0, which is the lifetime max (infinite window)
You can also skip reduction and collect individual values, such as a set of images you receive from your environment over time that don’t make sense to reduce. Use the reduce="item" or reduce="item_series" argument. Use your best judgment about what you log, because RLlib reports all logged values unless you clean them up yourself.
logger.log_value("some_items", value="a", reduce="item_series")
logger.log_value("some_items", value="b", reduce="item_series")
logger.log_value("an_item", value="c", reduce="item")
logger.log_value("an_item", value="d", reduce="item")

logger.peek("some_items")  # expect a list: ["a", "b"]
logger.peek("an_item")  # expect a string: "d"

logger.reduce()
logger.peek("some_items")  # expect an empty list: []
logger.peek("an_item")  # expect None: []
Logging non-scalar data#
Warning
You might be tempted to use MetricsLogger to move data from one place in RLlib to another, for example to store data between EnvRunner callbacks, or to move videos captured from the environment from EnvRunners to the Algorithm object. Handle these cases with caution, and prefer other solutions. Callbacks can create custom attributes on EnvRunners, and you probably do not want RLlib to treat your videos as metrics. RLlib treats MetricsLogger as a means to collect metrics from parallel components and aggregate them. It handles metrics, and metrics flow in one direction, from the parallel components to the root component. If your use case does not fit this pattern, find another approach.
MetricsLogger isn’t limited to scalar values. If you still want to use it to move data from one place in RLlib to another, you can log images, videos, or other complex data.
For example, to log three consecutive image frames from a CartPole environment, use the reduce="item_series" argument:
import gymnasium as gym

env = gym.make("CartPole-v1")

# Log three consecutive render frames from the env.
env.reset()
logger.log_value("some_images", value=env.render(), reduce="item_series")
env.step(0)
logger.log_value("some_images", value=env.render(), reduce="item_series")
env.step(1)
logger.log_value("some_images", value=env.render(), reduce="item_series")
Timers#
You can use MetricsLogger as a context manager to log timer results. Time any code block in your custom code with a single with MetricsLogger.log_time(...) line:
import time
from ray.rllib.utils.metrics.metrics_logger import MetricsLogger

logger = MetricsLogger()

# First delta measurement:
with logger.log_time("my_block_to_be_timed", reduce="ema", ema_coeff=0.1):
    time.sleep(1.0)

# EMA should be ~1sec.
assert 1.1 > logger.peek("my_block_to_be_timed") > 0.9

# Second delta measurement:
with logger.log_time("my_block_to_be_timed"):
    time.sleep(2.0)

# EMA should be ~1.1sec.
assert 1.15 > logger.peek("my_block_to_be_timed") > 1.05
Counters#
To count things, such as the number of environment steps taken in a sample phase, and add up those counts over the lifetime or over a particular phase, use the reduce="sum" or reduce="lifetime_sum" argument in the call to log_value().
from ray.rllib.utils.metrics.metrics_logger import MetricsLogger

logger = MetricsLogger()

logger.log_value("my_counter", 50, reduce="sum")
logger.log_value("my_counter", 25, reduce="sum")
logger.peek("my_counter")  # expect: 75
logger.reduce()
logger.peek("my_counter")  # expect: 0 (upon reduction, all values are cleared)
If you log lifetime metrics with reduce="lifetime_sum", RLlib sums them over the lifetime of the experiment, even after you resume from a checkpoint. You can’t meaningfully peek lifetime_sum values outside the root MetricsLogger. RLlib sums the lifetime sum at the root MetricsLogger, but keeps only the most recent values in parallel components and clears them on each reduce.
Throughput measurements#
A metric logged with reduce="sum" or reduce="lifetime_sum" can also measure throughput. RLlib calculates the throughput once per metrics reporting cycle, so the throughput is always relative to the speed of the metrics reduction cycle.
Use the peek() method to access the throughput value by passing the throughput=True flag.
import time
from ray.rllib.utils.metrics.metrics_logger import MetricsLogger

logger = MetricsLogger(root=True)

for _ in range(3):
    logger.log_value("lifetime_sum", 5, reduce="sum", with_throughput=True)


time.sleep(1.0)
# Expect the throughput to be roughly 15/sec.
print(logger.peek("lifetime_sum", throughput=True))
Example 1: Use MetricsLogger in EnvRunner callbacks#
The following end-to-end example uses the MetricsLogger on an EnvRunner. It uses the RLlibCallback API to inject custom code into the RL environment loop.
The example computes the average “first-joint angle” of the Acrobot-v1 RL environment and logs the results through the MetricsLogger API.
This example is identical to another example, but it focuses only on the MetricsLogger aspects of the code.
import math
import numpy as np
from ray.rllib.algorithms.ppo import PPOConfig
from ray.rllib.callbacks.callbacks import RLlibCallback

# Define a custom RLlibCallback.

class LogAcrobotAngle(RLlibCallback):

    def on_episode_created(self, *, episode, **kwargs):
        # Initialize an empty list in the `custom_data` property of `episode`.
        episode.custom_data["theta1"] = []

    def on_episode_step(self, *, episode, env, **kwargs):
        # Compute the angle at every episode step and store it temporarily in episode:
        state = env.envs[0].unwrapped.state
        deg_theta1 = math.degrees(math.atan2(state[1], state[0]))
        episode.custom_data["theta1"].append(deg_theta1)

    def on_episode_end(self, *, episode, metrics_logger, **kwargs):
        theta1s = episode.custom_data["theta1"]
        avg_theta1 = np.mean(theta1s)

        # Log the resulting average angle - per episode - to the MetricsLogger.
        # Report with a sliding window of 50.
        metrics_logger.log_value("theta1_mean", avg_theta1, reduce="mean", window=50)

config = (
    PPOConfig()
    .environment("Acrobot-v1")
    .callbacks(
        callbacks_class=LogAcrobotAngle,
    )
)
ppo = config.build()

# Train n times. Expect `theta1_mean` to be found in the results under:
# `env_runners/theta1_mean`
for i in range(2):
    results = ppo.train()
    print(
        f"iter={i} "
        f"theta1_mean={results['env_runners']['theta1_mean']} "
        f"R={results['env_runners']['episode_return_mean']}"
    )
For a more complex example, see how to generate and log a PacMan heatmap image to WandB.
Example 2: Use MetricsLogger in a custom loss function#
You can log metrics inside your custom loss functions. Use the Learner’s own Learner.metrics attribute for this.
@override(TorchLearner)
def compute_loss_for_module(self, *, module_id, config, batch, fwd_out):
    ...

    loss_xyz = ...

    # Log a specific loss term.
    # Each learner will sum up the loss_xyz value and send it to the root MetricsLogger.
    self.metrics.log_value("special_loss_term", reduce="sum", value=loss_xyz)

    total_loss = loss_abc + loss_xyz

    return total_loss
For a runnable example, see logging custom values inside a loss function.
Example 3: Use MetricsLogger in a custom Algorithm#
You can log metrics inside your custom Algorithm training_step() method. Use the Algorithm’s own Algorithm.metrics attribute for this.
@override(Algorithm)
def training_step(self) -> None:
    ...

    # Log some value.
    self.metrics.log_value("some_mean_result", 1.5, reduce="mean", window=5)

    ...

    with self.metrics.log_time(("timers", "some_code")):
        ... # time some code
For a runnable example, see logging inside training_step().
Migrating to Ray 2.53#
If you used the MetricsLogger API before Ray 2.53, review the following changes.
The most important changes are the following:
Metrics clear once per
MetricsLogger.reduce()call. Peeking them afterward returns the zero-element for the reduce type, such asnp.nan,None, or an empty list.Base control flow on other variables rather than on peeking metrics.
The following changes affect MetricsLogger’s logging methods, such as log_value and log_time:
The
clear_on_reduceargument is deprecated. See the preceding point.Using
reduce="sum"withclear_on_reduce=Falseis equivalent toreduce="lifetime_sum".The
throughput_ema_coeffargument is deprecated. RLlib no longer uses EMA for throughputs.The
reduce_per_index_on_aggregateargument is deprecated. RLlib aggregates all metrics over all values collected from the leaves of any reduction cycle.
Other changes include the following:
Many metrics look noisier after you upgrade to 2.53, mostly because RLlib no longer smooths them. Do any smoothing downstream if you want it.
aggregate()is the only way to aggregate metrics.You can pass a custom stats class through
AlgorithmConfig.reporting(custom_stats_cls_lookup={...}). You can then write your own stats class with its own reduction logic. If your stats class fixes a bug or adds value to RLlib, consider contributing it to the project through a PR.When aggregating metrics, you can peek only the ones that RLlib merged in the most recent reduction cycle by passing the
latest_merged_only=Trueargument topeek().