Profiling a Ray Train Workload with PyTorch Profiler#
Time to complete: 15 min
This template profiles PyTorch training code with PyTorch Profiler to identify performance bottlenecks, optimize memory usage, and monitor training efficiency in distributed environments.
In this tutorial, you will:
Start with a basic single machine PyTorch example and learn profiling fundamentals.
Distribute it to multiple GPUs on multiple machines with Ray Train and profile the distributed training workload.
Explore advanced profiling techniques including memory profiling, performance analysis, and dashboard integration for comprehensive monitoring.
With Ray Train, you can profile distributed training workloads across multiple workers, enabling you to identify communication bottlenecks, load balancing issues, and resource utilization patterns that are critical for optimizing large-scale training jobs.
Anyscale specific configuration
Note: This tutorial is optimized for the Anyscale platform. When running on open source Ray, additional configuration is required. For example, you need to manually:
- Configure your Ray cluster: Set up your multi-node environment and manage resource allocation without Anyscale's automation.
- Manage dependencies: Manually install and manage dependencies on each node.
- Set up storage: Configure your own distributed or shared storage system for model checkpointing.
%%bash
pip install torch torchvision matplotlib
Distributed training with Ray Train and PyTorch Profiler#
This example demonstrates how to run PyTorch training with Ray Train with PyTorch profiler. This section uses a simple ResNet model to demonstrate how to use Pytorch Profiler and Ray Train together to analyze model performance.
With Ray Train, you can profile distributed training workloads across multiple workers, enabling you to identify communication bottlenecks, load balancing issues, and resource utilization patterns that are critical for optimizing large-scale training jobs.
First, set some environment variables and import Ray Train modules.
# Enable Ray Train V2 for the latest train API.
# V2 will be the default in an upcoming release.
import os
os.environ["RAY_TRAIN_V2_ENABLED"] = "1"

# Ray Train imports
import ray.train
import ray.train.torch
from ray.train import RunConfig, ScalingConfig
from ray.train.torch import TorchTrainer

# PyTorch imports
import torch
import torch.nn as nn
from torch.utils.data import DataLoader
from torchvision.datasets import FashionMNIST
from torchvision.models import resnet18
from torch.optim import Adam
from torch.nn import CrossEntropyLoss
from torchvision.transforms import Compose, ToTensor, Normalize

# Utility imports
import tempfile
import uuid
Next, create a distributed training function for Ray Train to launch. Each numbered comment in the below training function indicates the steps necessary for distributed training and profiling with Ray Train and Pytorch Profiler.
This tutorial uses cluster storage to allow for quick iteration and development, but this may not be suitable in production environments or at high scale. In those cases, you should use object storage instead. For more information about how to select your storage type, see the Anyscale storage configuration docs. The output of the script is available in the Files tab in Anyscale workspace. For those who don’t use Anyscale platform, you can view the logs and profiling output from the configuration location specified in RunConfig and Profiler.
# Configure storage path for profiling outputs and training results.
# This path serves two purposes:
# 1. Ray Train RunConfig uses it as the base location for experiment artifacts,
#    checkpoints, and logs (set via RunConfig's storage_path parameter).
# 2. PyTorch Profiler writes TensorBoard traces and memory profiles here
#    (used in tensorboard_trace_handler and export_memory_timeline calls).
# All profiling results and training artifacts will be stored under this path.
storage_path = "/mnt/cluster_storage/"
def train_func_distributed():
    """Distributed training function with enhanced profiling for Ray Train."""

    # Model, loss, optimizer
    model = resnet18(num_classes=10)
    model.conv1 = torch.nn.Conv2d(
        1, 64, kernel_size=(7, 7), stride=(2, 2), padding=(3, 3), bias=False
    )

    # [1] Prepare model for distributed training.
    # The prepare_model method wraps the model with DistributedDataParallel
    # and moves it to the correct GPU device.
    # ================================================================
    model = ray.train.torch.prepare_model(model)

    criterion = CrossEntropyLoss()
    optimizer = Adam(model.parameters(), lr=0.001)

    # Data
    transform = Compose([ToTensor(), Normalize((0.28604,), (0.32025,))])
    data_dir = os.path.join(tempfile.gettempdir(), "data")
    train_data = FashionMNIST(root=data_dir, train=True, download=True, transform=transform)
    train_loader = DataLoader(train_data, batch_size=128, shuffle=True)

    # [2] Prepare dataloader for distributed training.
    # The prepare_data_loader method assigns unique rows of data to each worker
    # and handles distributed sampling.
    # ========================================================================
    train_loader = ray.train.torch.prepare_data_loader(train_loader)

    world_rank = ray.train.get_context().get_world_rank()
    world_size = ray.train.get_context().get_world_size()

    # [3] Configure enhanced profiling for distributed training.
    # This includes TensorBoard integration and memory timeline export
    # for comprehensive performance analysis across workers.
    # See more details at https://docs.pytorch.org/docs/stable/profiler.html
    # =============================================================
    activities = [torch.profiler.ProfilerActivity.CPU, torch.profiler.ProfilerActivity.CUDA]

    with torch.profiler.profile(
        activities=activities,
        schedule=torch.profiler.schedule(wait=1, warmup=1, active=3, repeat=1),
        on_trace_ready=torch.profiler.tensorboard_trace_handler(f'{storage_path}/logs/distributed'),
        record_shapes=True,
        profile_memory=True,
        with_stack=True,
    ) as prof:

        # Training loop
        for epoch in range(10):
            # [4] Set epoch for distributed sampler to ensure proper shuffling
            # across all workers in each epoch.
            # ==============================================================
            if world_size > 1:
                train_loader.sampler.set_epoch(epoch)

            for batch_idx, (images, labels) in enumerate(train_loader):
                outputs = model(images)
                loss = criterion(outputs, labels)
                optimizer.zero_grad()
                loss.backward()
                optimizer.step()
                prof.step()

                # Log performance metrics every 50 batches
                if batch_idx % 50 == 0 and world_rank == 0:
                    print(f"Epoch {epoch}, Batch {batch_idx}, Loss: {loss.item():.4f}")

            # [5] Report metrics and checkpoint.
            # Each worker reports its metrics and saves checkpoints to shared storage.
            # ====================================================================
            metrics = {"loss": loss.item(), "epoch": epoch}
            with tempfile.TemporaryDirectory() as temp_checkpoint_dir:
                torch.save(
                    model.state_dict(),
                    os.path.join(temp_checkpoint_dir, "model.pt")
                )
                ray.train.report(
                    metrics,
                    checkpoint=ray.train.Checkpoint.from_directory(temp_checkpoint_dir),
                )

            # Log metrics from rank 0 only to avoid duplicate outputs
            if world_rank == 0:
                print(f"Epoch {epoch}, Loss: {loss.item():.4f}")

    # [6] Export memory timeline for each worker.
    # This creates separate memory profiles for each worker to analyze
    # memory usage patterns across the distributed training job.
    # ==============================================================
    run_name = ray.train.get_context().get_experiment_name()
    prof.export_memory_timeline(
        f"{storage_path}/{run_name}/rank{world_rank}_memory_profile.html"
    )

    if world_rank == 0:
        print(f"Distributed profiling complete! Check '/mnt/cluster_storage/{run_name}/' for worker-specific memory profiles.")
        print("Files generated:")
        print(f"  - rank{world_rank}_memory_profile.html (Memory analysis)")
        print(f"  - rank{world_rank}_chrome_trace.json (Chrome trace)")
        print("  - TensorBoard logs in /mnt/cluster_storage/logs/distributed/")
Finally, run the distributed training function with Ray Train. The TorchTrainer orchestrates the distributed training job across multiple workers, each running the profiling-enabled training function.
# Configure scaling and resource requirements for distributed training
scaling_config = ray.train.ScalingConfig(num_workers=2, use_gpu=True)

# Create a unique experiment name for this profiling run
experiment_name = f"profiling_run_{uuid.uuid4().hex[:8]}"

# Configure run settings with persistent storage for profiling outputs.
# The storage_path parameter tells Ray Train where to store experiment artifacts,
# checkpoints, and logs. This is also the same path where PyTorch Profiler outputs
# (TensorBoard traces and memory profiles) are written to, allowing you to access
# all training and profiling results from a single location.
run_config = ray.train.RunConfig(
    storage_path=storage_path,
    name=experiment_name,
)

# Launch distributed training job with profiling
trainer = ray.train.torch.TorchTrainer(
    train_func_distributed,
    scaling_config=scaling_config,
    run_config=run_config,
)

print(f"Starting distributed training with profiling: {experiment_name}")
result = trainer.fit()
print(f"Distributed training with profiling completed successfully! Results are: {result}")
print(f"Check '{storage_path}/{experiment_name}/' for profiling results.")
Advanced profiling techniques and dashboard integration#
This section explores advanced profiling techniques including custom profiling schedules, performance analysis, and integration with Ray Train’s monitoring capabilities. These techniques help you gain deeper insights into your training workload performance and identify optimization opportunities.
Custom profiling schedules and performance analysis#
PyTorch Profiler offers flexible scheduling options to capture different phases of training. You can configure when profiling occurs to focus on specific operations or phases of your training loop.
The following code section adapts the previous training function with torch.profile.record_function to record some specific operations.
def train_func_advanced_profiling():
    """Advanced profiling example with custom schedules and performance analysis."""

    # Model setup
    model = resnet18(num_classes=10)
    model.conv1 = torch.nn.Conv2d(
        1, 64, kernel_size=(7, 7), stride=(2, 2), padding=(3, 3), bias=False
    )
    model = ray.train.torch.prepare_model(model)

    criterion = CrossEntropyLoss()
    optimizer = Adam(model.parameters(), lr=0.001)

    # Data setup
    transform = Compose([ToTensor(), Normalize((0.28604,), (0.32025,))])
    data_dir = os.path.join(tempfile.gettempdir(), "data")
    train_data = FashionMNIST(root=data_dir, train=True, download=True, transform=transform)
    train_loader = DataLoader(train_data, batch_size=128, shuffle=True)
    train_loader = ray.train.torch.prepare_data_loader(train_loader)

    world_rank = ray.train.get_context().get_world_rank()

    # [1] Advanced profiling configuration with custom schedule.
    # This schedule profiles every 2nd step to reduce overhead while
    # still capturing representative performance data.
    # ==============================================================
    activities = [torch.profiler.ProfilerActivity.CPU, torch.profiler.ProfilerActivity.CUDA]

    # Custom schedule: wait=1, warmup=1, active=3, repeat=1
    # This means the profiler skips 1 step, then warmups for 1 step, then does the active profiling for 3 steps, then repeats.
    # See more details at https://docs.pytorch.org/docs/stable/profiler.html#torch.profiler.schedule
    schedule = torch.profiler.schedule(wait=1, warmup=1, active=3, repeat=1)

    with torch.profiler.profile(
        activities=activities,
        schedule=schedule,
        on_trace_ready=torch.profiler.tensorboard_trace_handler(f'{storage_path}/logs/advanced'),
        record_shapes=True,
        profile_memory=True,
        with_stack=True,
        # [2] Enable experimental Kineto library features for enhanced analysis.
        # Kineto is a library that provides performance observability and diagnostic to deprecate TensorBoard.
        # See more details at https://github.com/pytorch/kineto.
        # ======================================================
        experimental_config=torch.profiler._ExperimentalConfig(verbose=True),
    ) as prof:

        # Training loop with performance monitoring
        for epoch in range(10):
            if ray.train.get_context().get_world_size() > 1:
                train_loader.sampler.set_epoch(epoch)

            epoch_start_time = torch.cuda.Event(enable_timing=True)
            epoch_end_time = torch.cuda.Event(enable_timing=True)

            epoch_start_time.record()

            for batch_idx, (images, labels) in enumerate(train_loader):
                # [3] Profile individual operations for detailed analysis.
                # ========================================================
                with torch.profiler.record_function("forward_pass"):
                    outputs = model(images)

                with torch.profiler.record_function("loss_computation"):
                    loss = criterion(outputs, labels)

                with torch.profiler.record_function("backward_pass"):
                    optimizer.zero_grad()
                    loss.backward()
                    optimizer.step()

                prof.step()

                # Log performance metrics every 50 batches
                if batch_idx % 50 == 0 and world_rank == 0:
                    print(f"Epoch {epoch}, Batch {batch_idx}, Loss: {loss.item():.4f}")

            epoch_end_time.record()
            # Wait for GPU operations to complete since CUDA operations are asynchronous.
            torch.cuda.synchronize()

            # [4] Calculate and report timing metrics.
            # ======================================
            epoch_time = epoch_start_time.elapsed_time(epoch_end_time)
            metrics = {
                "loss": loss.item(),
                "epoch": epoch,
                "epoch_time_ms": epoch_time,
                "profiler_step": prof.step_num
            }

            with tempfile.TemporaryDirectory() as temp_checkpoint_dir:
                torch.save(
                    model.state_dict(),
                    os.path.join(temp_checkpoint_dir, "model.pt")
                )
                ray.train.report(
                    metrics,
                    checkpoint=ray.train.Checkpoint.from_directory(temp_checkpoint_dir),
                )

            if world_rank == 0:
                print(f"Epoch {epoch} completed in {epoch_time:.2f}ms")

    # [5] Export comprehensive profiling data.
    # ======================================
    run_name = ray.train.get_context().get_experiment_name()

    # Export memory timeline
    prof.export_memory_timeline(
        f"{storage_path}/{run_name}/rank{world_rank}_advanced_memory_profile.html"
    )


    if world_rank == 0:
        print(f"Advanced profiling complete! Check '{storage_path}/{run_name}/' for detailed profiling results.")
        print("Files generated:")
        print(f"  - rank{world_rank}_advanced_memory_profile.html (Memory analysis)")
        print(f"  - rank{world_rank}_chrome_trace.json (Chrome trace)")
        print(f"  - TensorBoard logs in '{storage_path}/logs/advanced/'")
Kick off the Ray Train job similarly to the previous step.
# Run the advanced profiling example
scaling_config = ray.train.ScalingConfig(num_workers=2, use_gpu=True)

# Create a unique experiment name for advanced profiling
advanced_experiment_name = f"advanced_profiling_{uuid.uuid4().hex[:8]}"

# Configure run settings with storage_path for both Ray Train artifacts and profiler output
run_config = ray.train.RunConfig(
    storage_path=storage_path,
    name=advanced_experiment_name,
)

# Launch advanced profiling training job
trainer = ray.train.torch.TorchTrainer(
    train_func_advanced_profiling,
    scaling_config=scaling_config,
    run_config=run_config,
)

print(f"Starting advanced profiling training: {advanced_experiment_name}")
result = trainer.fit()
print(f"Advanced profiling training completed successfully! Results are: {result}")
print(f"Check '{storage_path}/{advanced_experiment_name}/' for comprehensive profiling results.")
Analyzing profiling results#
After running the profiling examples, you have access to several types of profiling data:
TensorBoard traces: Located in
/mnt/cluster_storage/logs/or the persistent storage that you configured. Use these traces to visualize GPU/CPU utilization, kernel execution times, and memory allocation patterns.Memory timeline HTML files: Worker-specific memory profiles showing memory usage over time, helping identify memory leaks and optimization opportunities.
Ray Train dashboard: If using Anyscale workspace, access the Ray Train dashboard to monitor real-time metrics, worker status, and resource utilization.
Key profiling insights to look for:#
GPU utilization: Ensure your workload is using GPUs efficiently (high utilization percentage)
Memory usage patterns: Look for memory spikes, leaks, or inefficient allocation patterns
Communication overhead: Monitor time spent on gradient synchronization
Data loading bottlenecks: Identify if data loading is limiting training throughput
Kernel efficiency: Analyze which operations are taking the most time and optimize accordingly
Tensorboard plugin with PyTorch Profiler and tracing.#
After generating the trace.json files, you can use Tensorboard, or drag the trace.json into Perfetto UI or chrome://tracing to visualize your profile.
Use the script below to start the Tensorboard.
pip install torch_tb_profiler

# Once you run the above code, the profiling result is saved under `/mnt/cluster_storage/logs/`
tensorboard --logdir=/mnt/cluster_storage/logs/
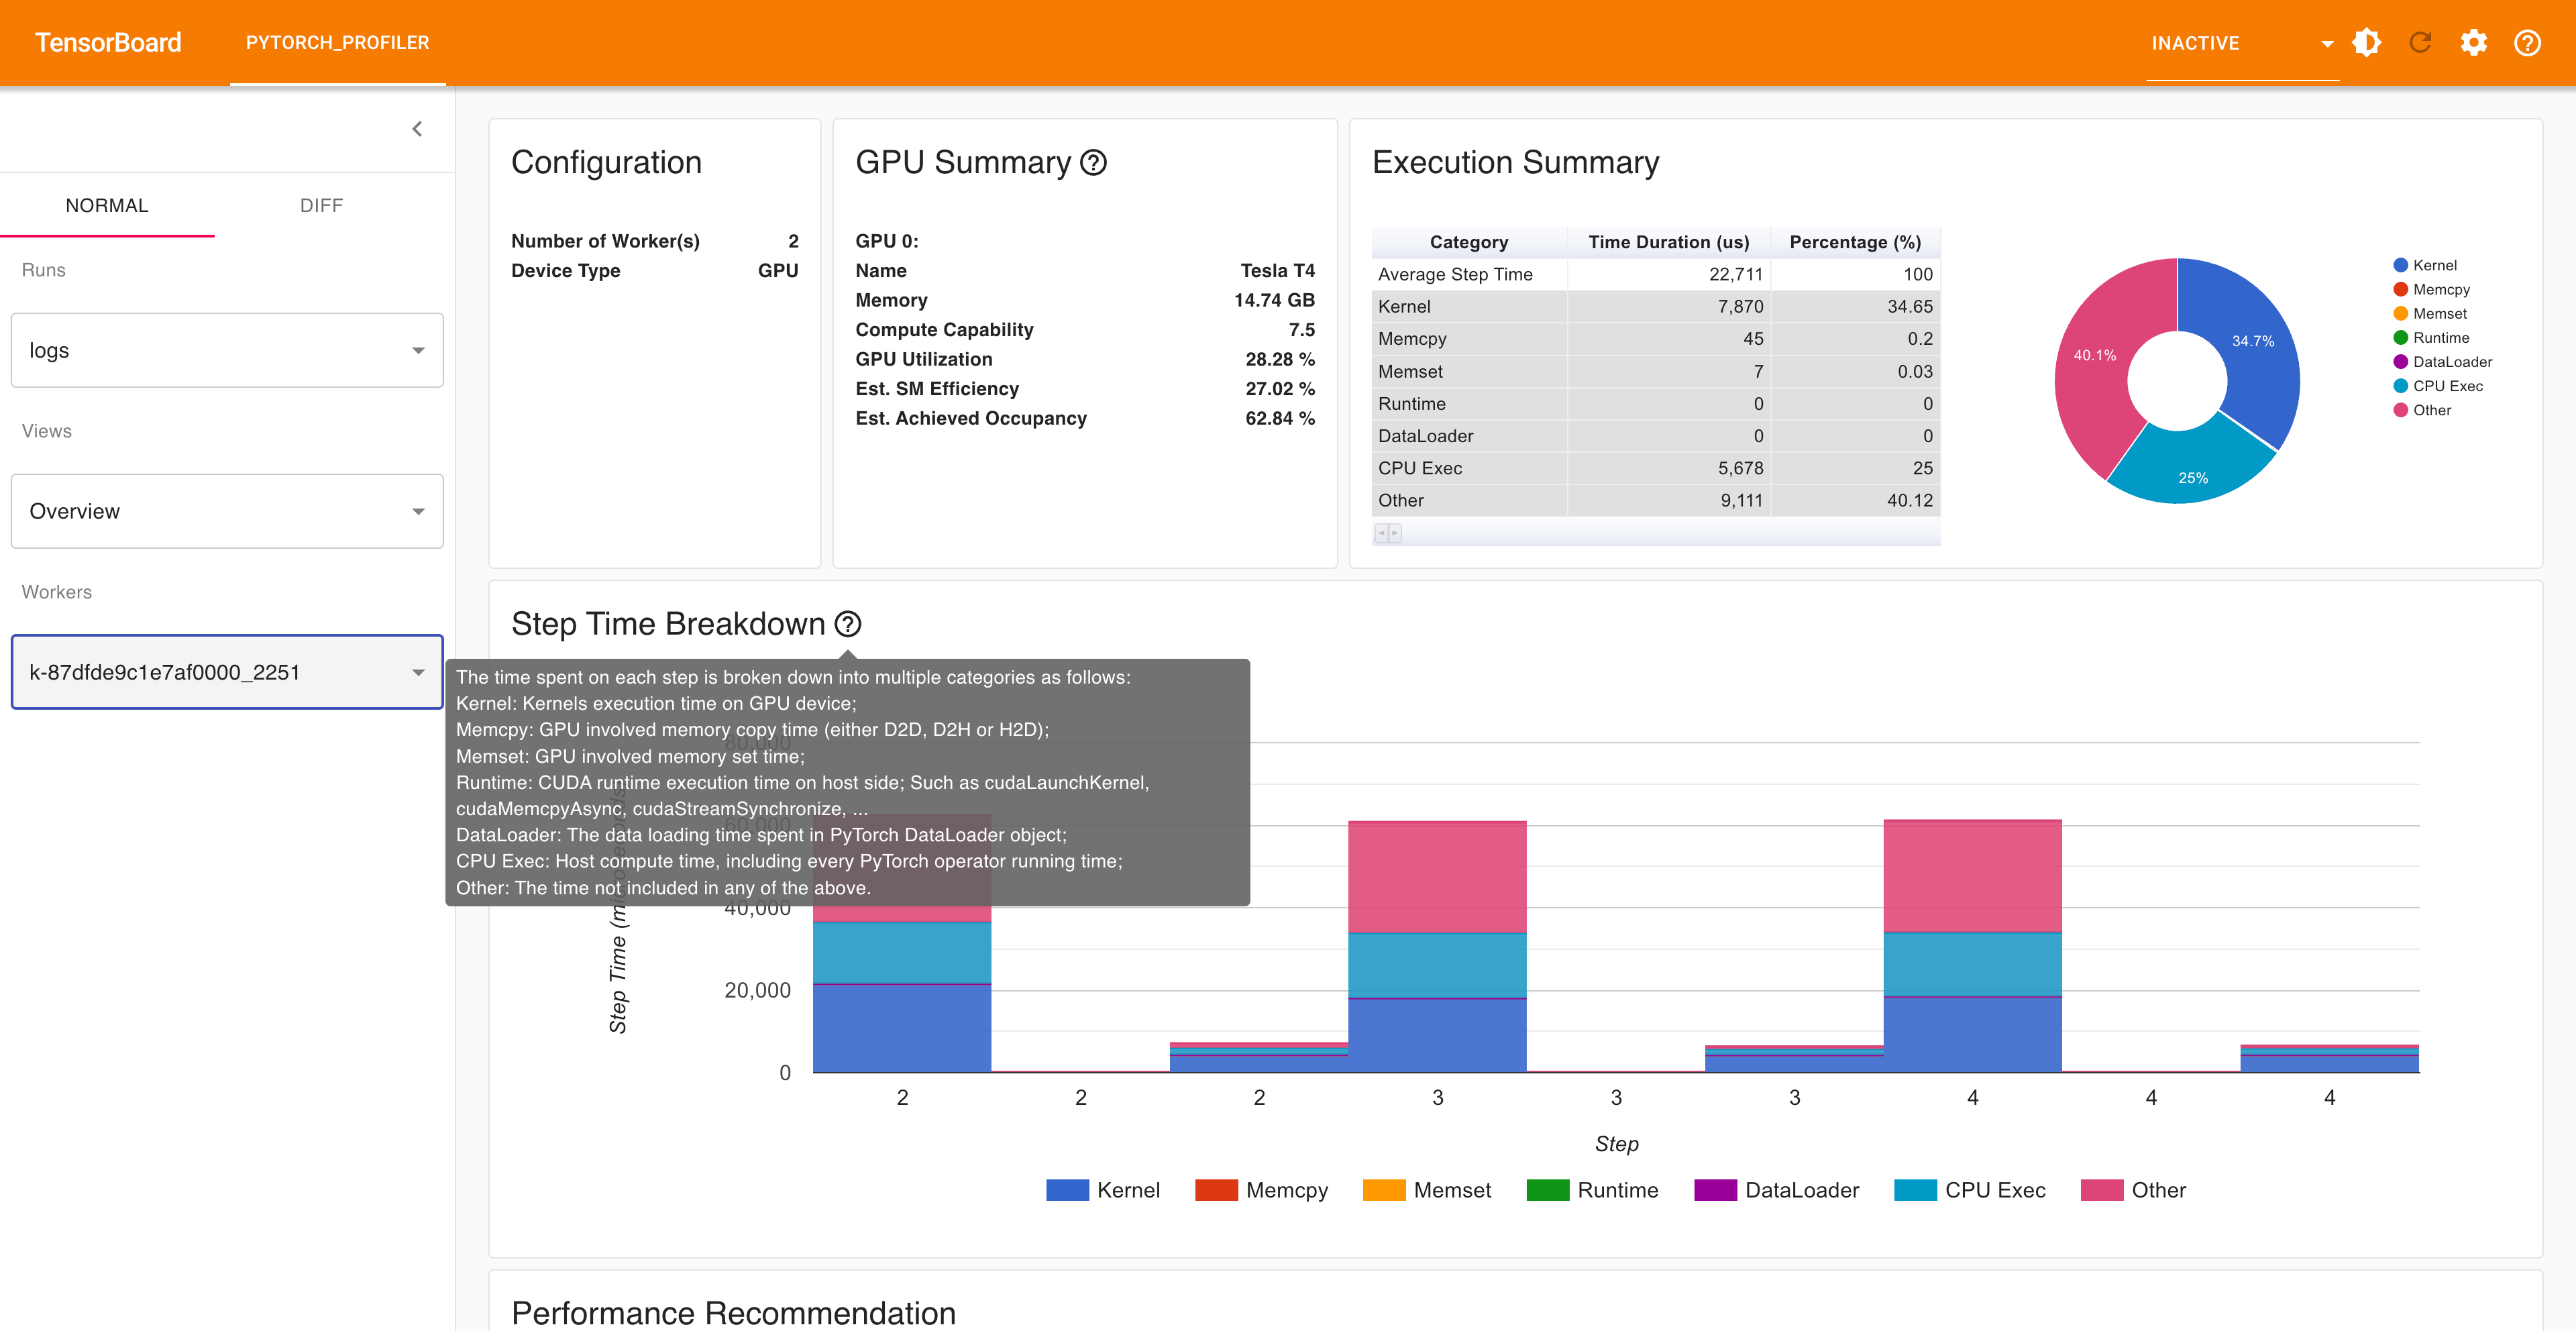
Open the TensorBoard profile URL in a browser and you can see the Profiler plugin page as shown below.
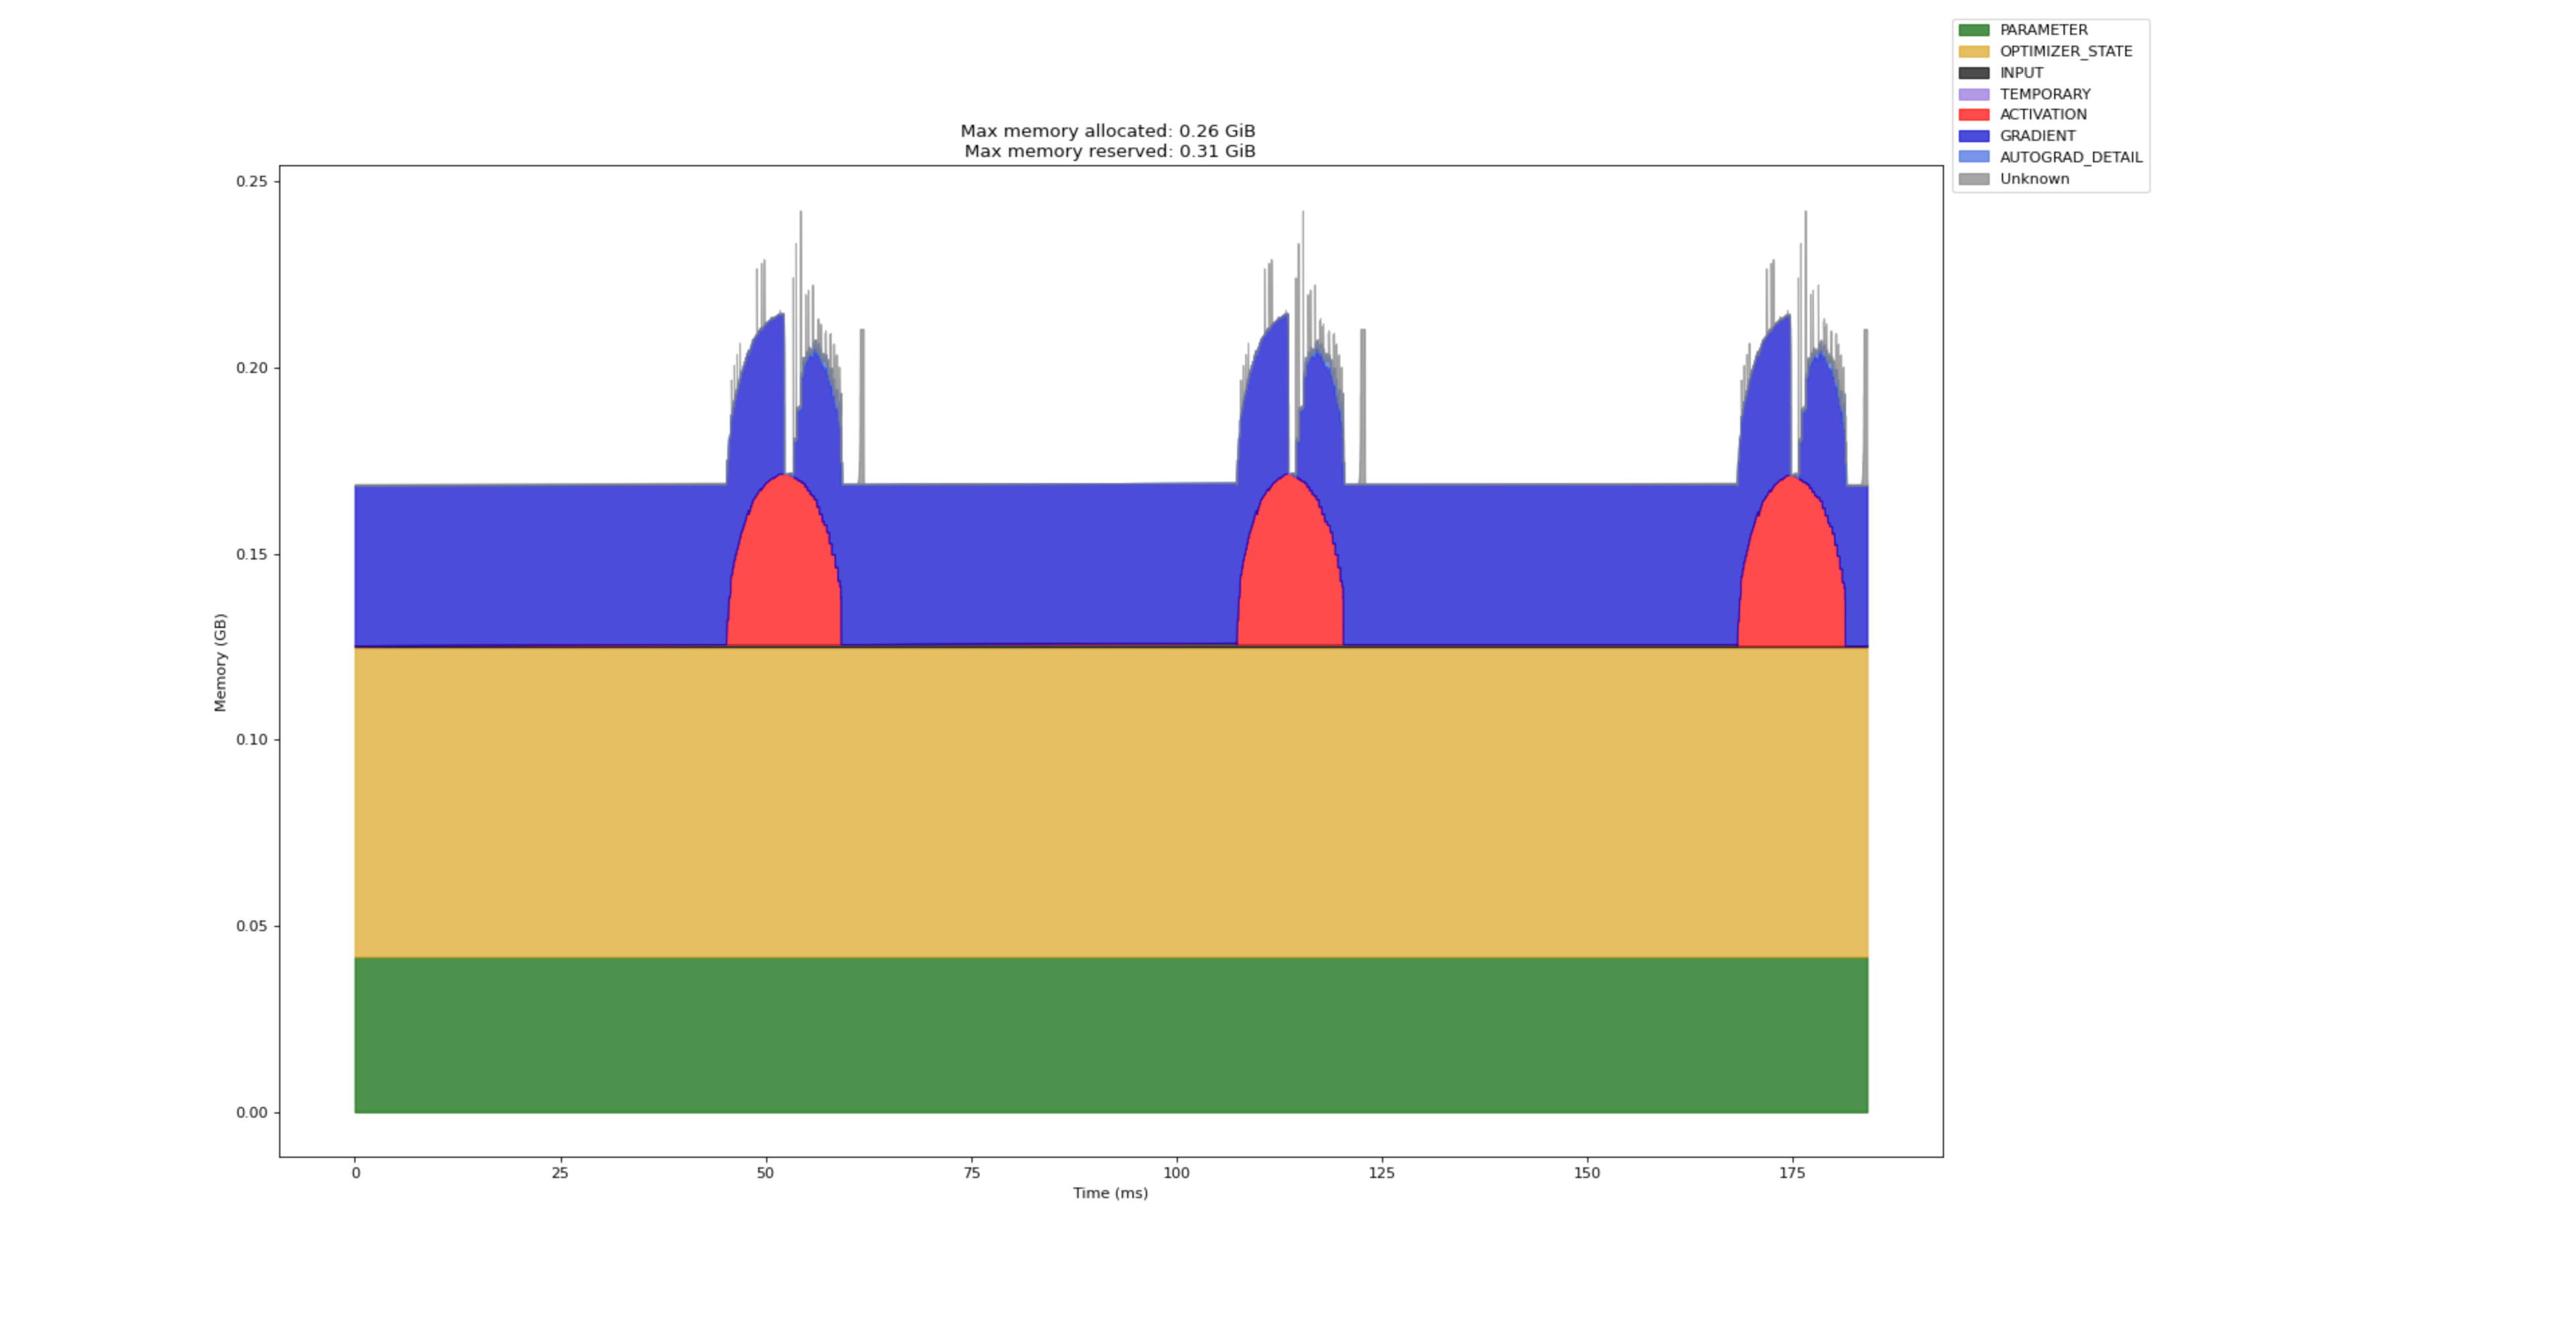
The following page shows worker-specific memory profiles showing memory usage over time, helping identify memory leaks and optimization opportunities.
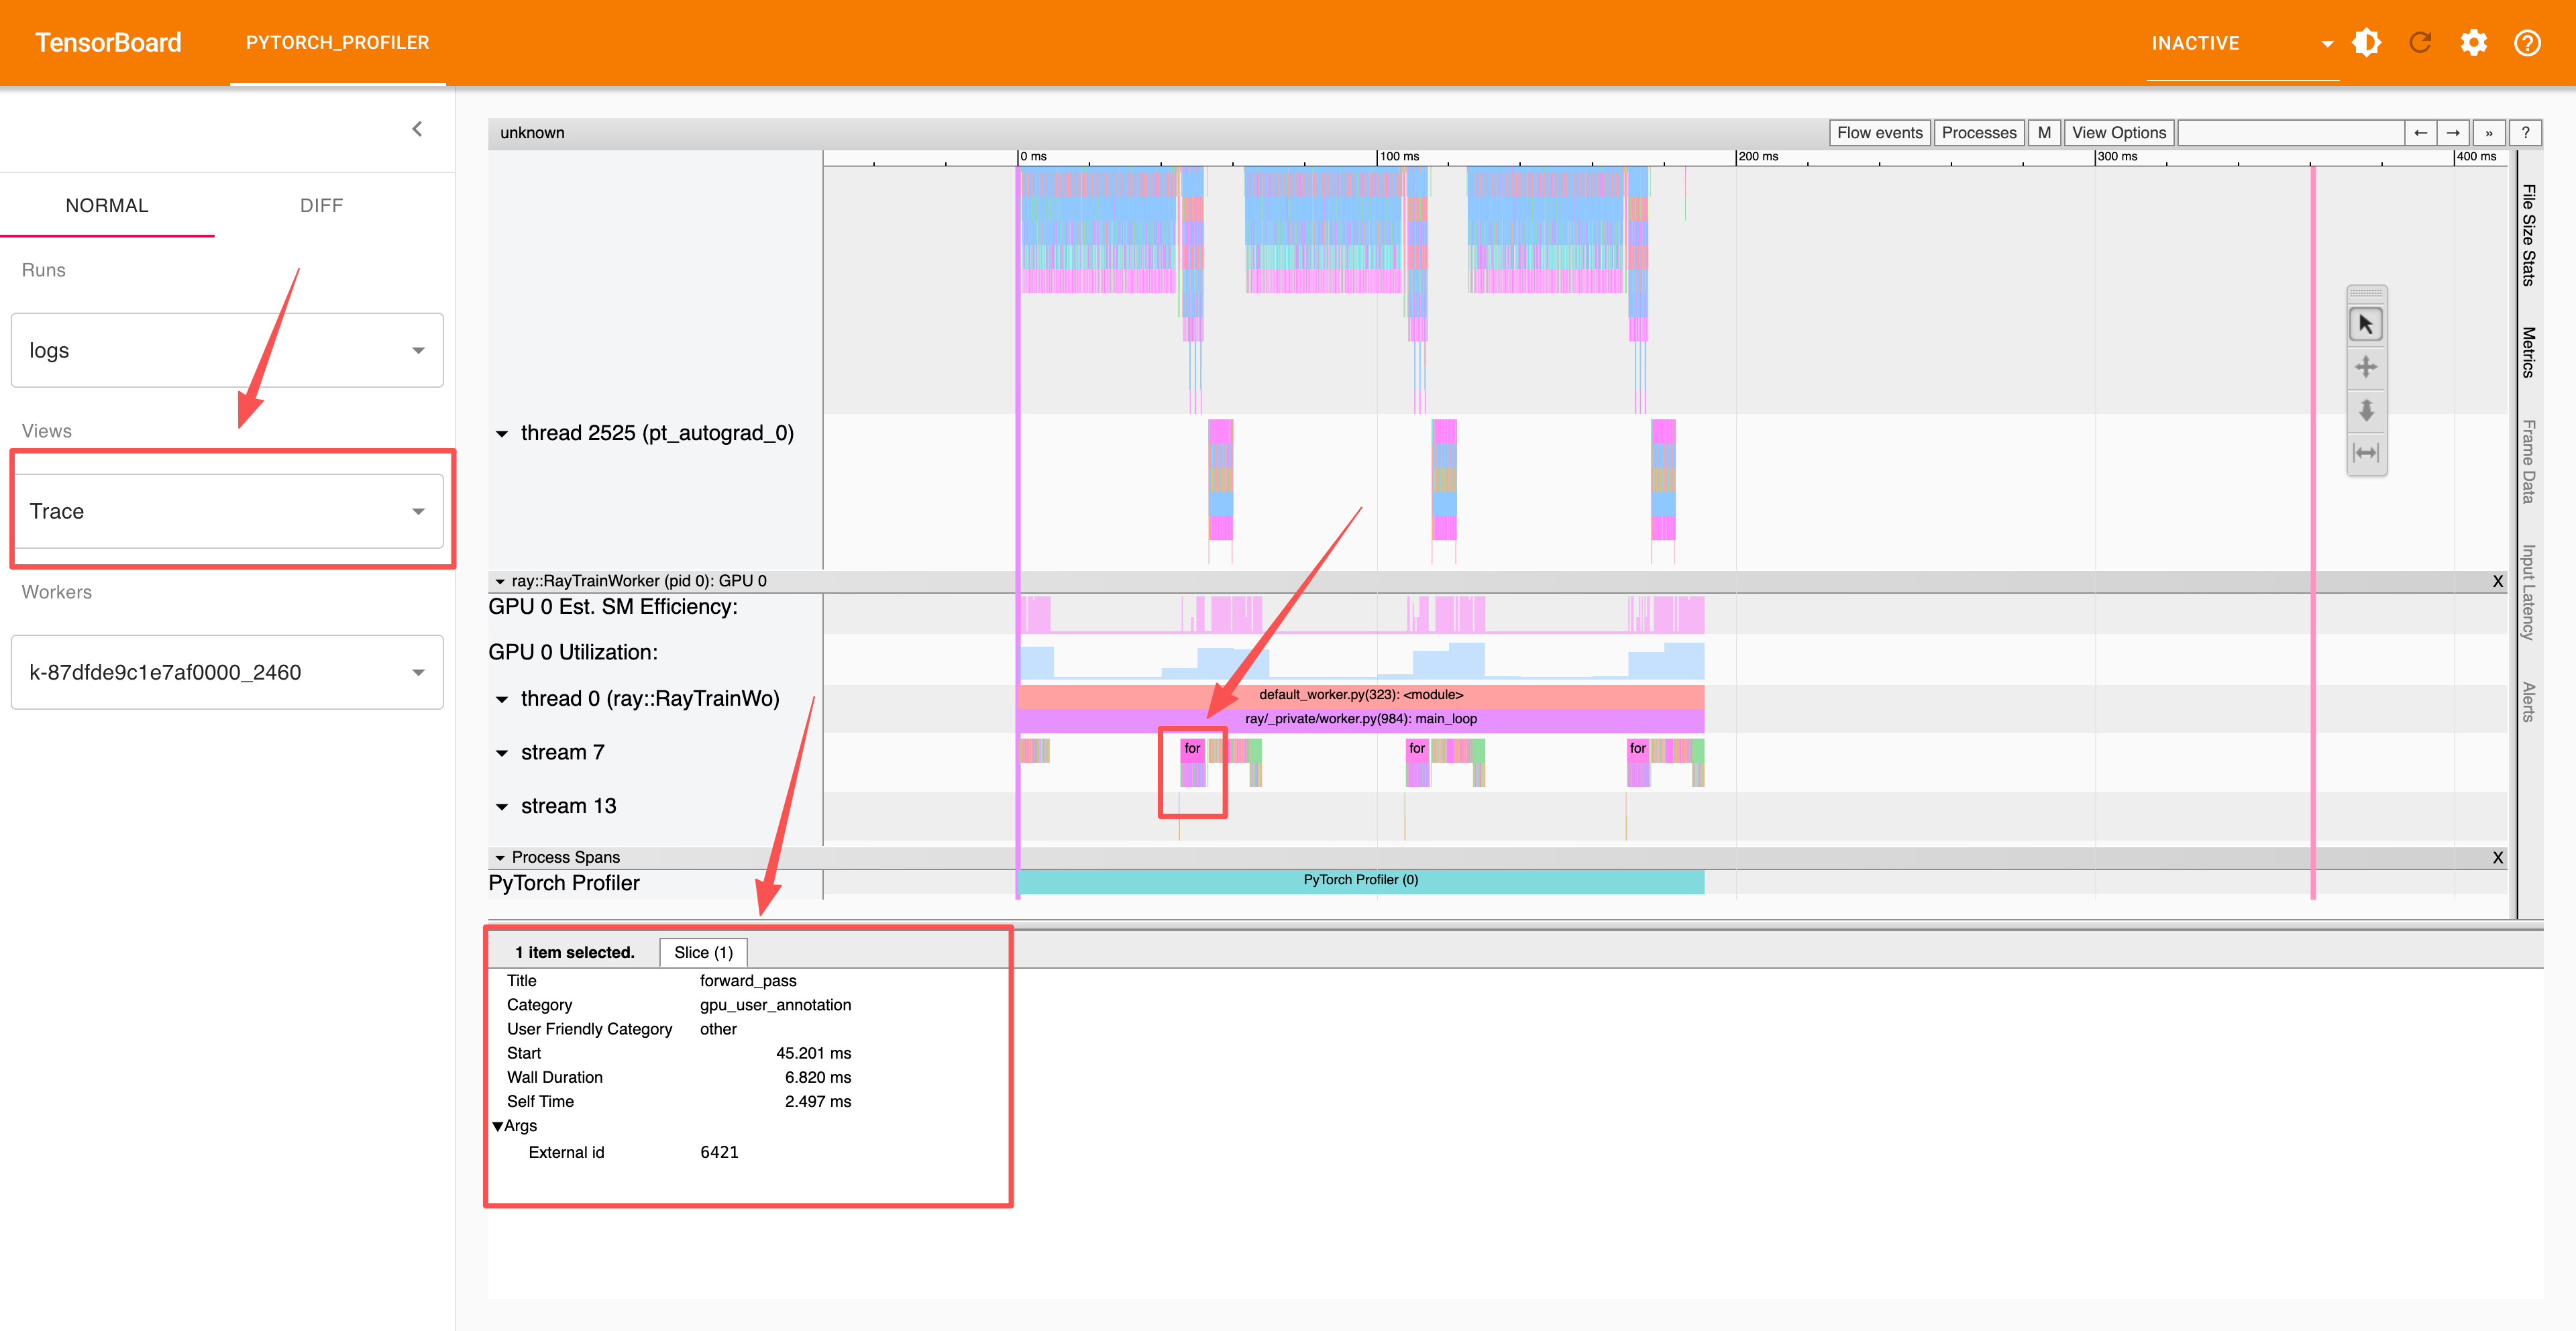
The advanced section uses record_function context to profile individual operations, which you can view in the trace section:
Summary#
In this notebook, you learned how to profile Ray Train workloads using PyTorch Profiler:
Single machine profiling: Started with basic profiling fundamentals, learning how to integrate PyTorch Profiler into your training loop to monitor performance and identify bottlenecks.
Distributed profiling: Scaled to multi-worker distributed training with Ray Train, enabling profiling across multiple GPUs and machines to identify communication overhead and load balancing issues.
Advanced profiling techniques: Explored custom profiling schedules, operation-level profiling, and comprehensive data export including TensorBoard traces, memory timelines, and Chrome traces.
Performance optimization: Gained insights into GPU utilization, memory usage patterns, and training efficiency through detailed profiling analysis.