Visualization#
Ray Compiled Graph provides visualization functionalities to help users with development and debugging.
Graph structure#
To visualize the graph structure, call the visualize method after calling experimental_compile
on the graph.
import ray
from ray.dag import InputNode, MultiOutputNode

@ray.remote
class Worker:
    def inc(self, x):
        return x + 1

    def double(self, x):
        return x * 2

    def echo(self, x):
        return x

sender1 = Worker.remote()
sender2 = Worker.remote()
receiver = Worker.remote()

with InputNode() as inp:
    w1 = sender1.inc.bind(inp)
    w1 = receiver.echo.bind(w1)
    w2 = sender2.double.bind(inp)
    w2 = receiver.echo.bind(w2)
    dag = MultiOutputNode([w1, w2])

compiled_dag = dag.experimental_compile()
compiled_dag.visualize(filename="compiled_graph_viz", format="png")
By default, Ray generates a PNG image named compiled_graph.png and saves it in the current working directory.
You can override the filename or format by specifying the filename and format arguments. The format
can be any graphviz supported format, note that this requires you to install graphviz.
The preceding code generates a compiled_graph_viz.png file:
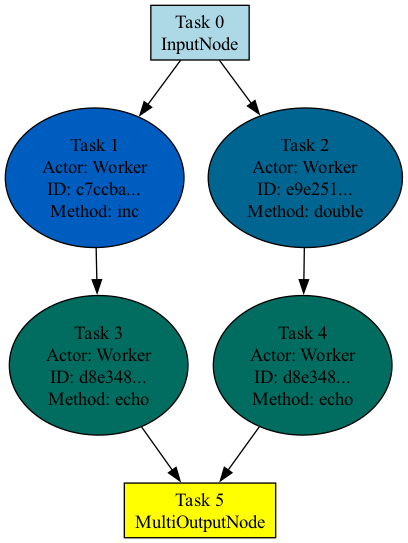
Note that the visualization shows tasks of the same actor as the same color.
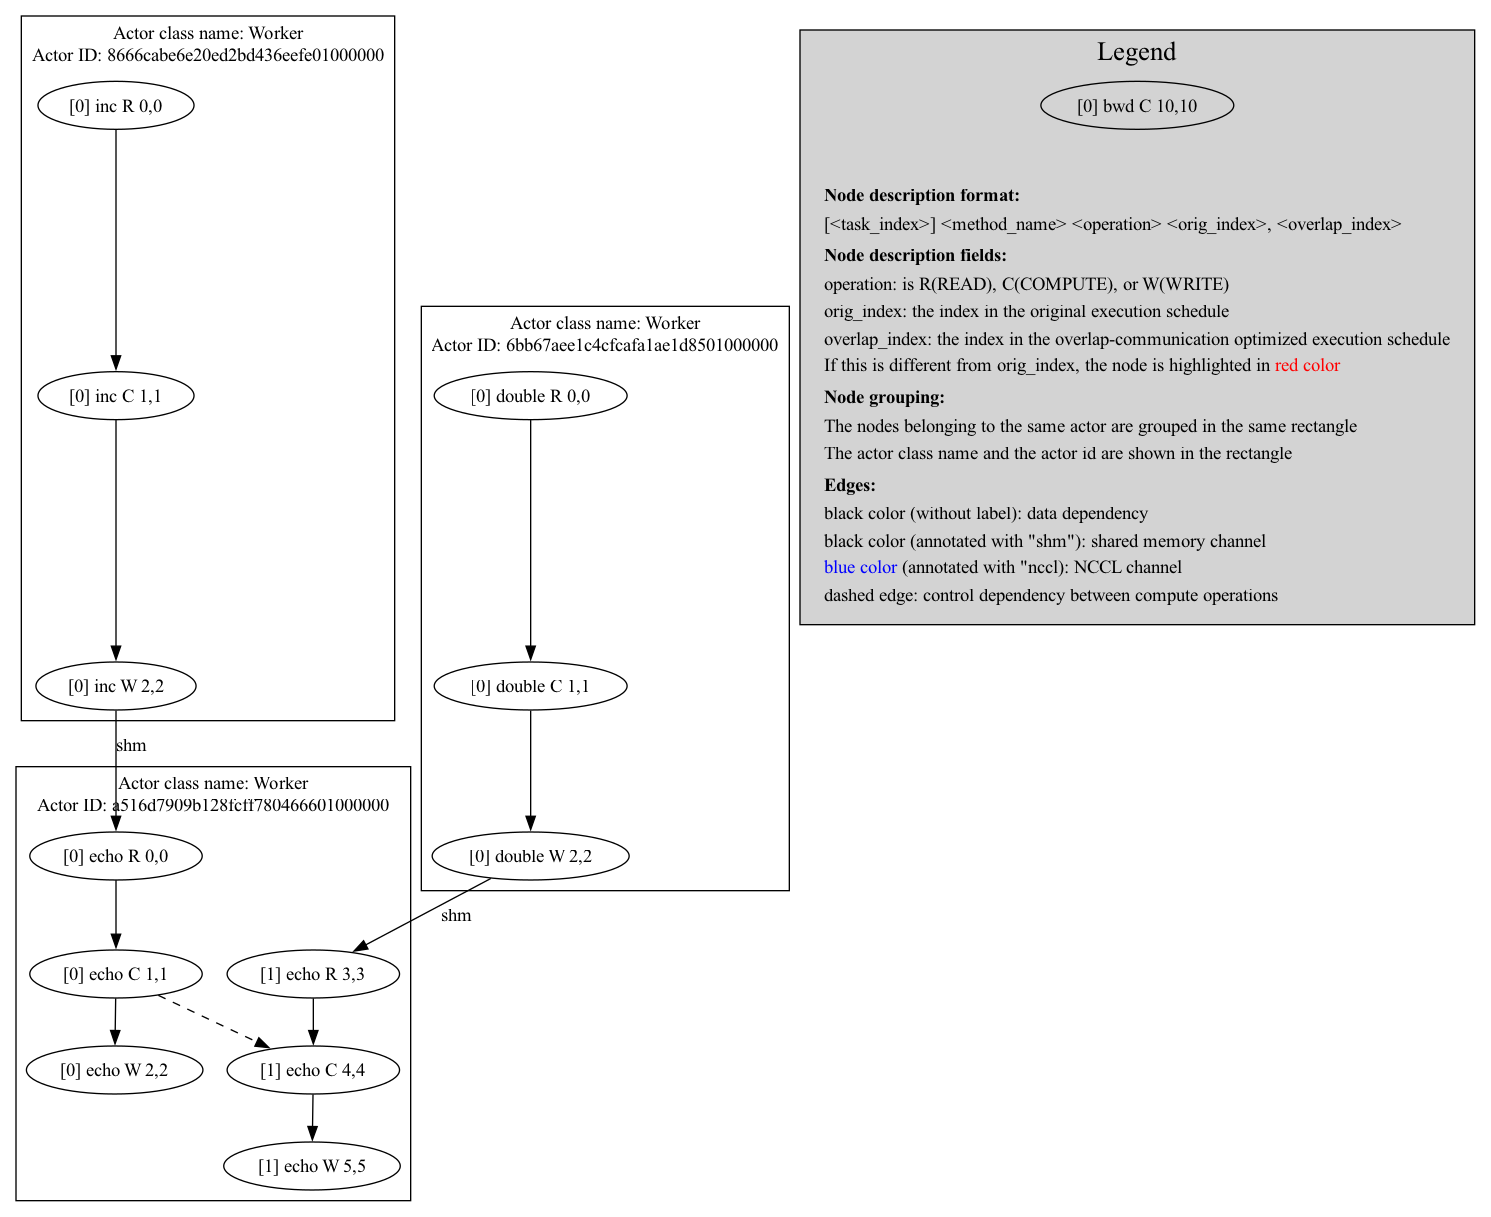
Execution schedule#
Compiled Graph generates an execution schedule for each of the participating actors. This schedule is useful information for understanding how Ray executes the graph at runtime.
To visualize the execution schedule, set the environment variable RAY_CGRAPH_VISUALIZE_SCHEDULE=1
when running the script. For example, save the preceding code in a script named example.py,
and run the following command:
RAY_CGRAPH_VISUALIZE_SCHEDULE=1 python3 example.py
When Ray executes experimental_compile, it generates a PNG image named compiled_graph_schedule.png and
saves it in the current working directory. The following is the visualization for the preceding code: