Log Persistence#
Logs (both system and application logs) are useful for troubleshooting Ray applications and Clusters. For example, you may want to access system logs if a node terminates unexpectedly.
Similar to Kubernetes, Ray does not provide a native storage solution for log data. Users need to manage the lifecycle of the logs by themselves. This page provides instructions on how to collect logs from Ray Clusters that are running on Kubernetes.
Tip
Skip to the deployment instructions for a sample configuration showing how to extract logs from a Ray pod.
Ray log directory#
By default, Ray writes logs to files in the directory /tmp/ray/session_*/logs on each Ray pod’s file system, including application and system logs. Learn more about the log directory and log files and the log rotation configuration before you start to collect the logs.
Log processing tools#
There are a number of open source log processing tools available within the Kubernetes ecosystem. This page shows how to extract Ray logs using Fluent Bit. Other popular tools include Vector, Fluentd, Filebeat, and Promtail.
Log collection strategies#
To write collected logs to a pod’s filesystem ,use one of two logging strategies: sidecar containers or daemonsets. Read more about these logging patterns in the Kubernetes documentation.
Sidecar containers#
We provide an example of the sidecar strategy in this guide.
You can process logs by configuring a log-processing sidecar
for each Ray pod. Ray containers should be configured to share the /tmp/ray
directory with the logging sidecar via a volume mount.
You can configure the sidecar to do either of the following:
Stream Ray logs to the sidecar’s stdout.
Export logs to an external service.
Daemonset#
Alternatively, it is possible to collect logs at the Kubernetes node level.
To do this, one deploys a log-processing daemonset onto the Kubernetes cluster’s
nodes. With this strategy, it is key to mount
the Ray container’s /tmp/ray directory to the relevant hostPath.
Setting up logging sidecars with Fluent Bit#
In this section, we give an example of how to set up log-emitting Fluent Bit sidecars for Ray pods.
See the full config for a single-pod RayCluster with a logging sidecar here. We now discuss this configuration and show how to deploy it.
Configuring log processing#
The first step is to create a ConfigMap with configuration for Fluent Bit.
Here is a minimal ConfigMap which tells a Fluent Bit sidecar to
Tail Ray logs.
Output the logs to the container’s stdout.
apiVersion: v1
kind: ConfigMap
metadata:
  name: fluentbit-config
data:
  fluent-bit.conf: |
    [INPUT]
        Name tail
        Path /tmp/ray/session_latest/logs/*
        Tag ray
        Path_Key true
        Refresh_Interval 5
    [OUTPUT]
        Name stdout
        Match *
A few notes on the above config:
In addition to streaming logs to stdout, you can use an [OUTPUT] clause to export logs to any storage backend supported by Fluent Bit.
The
Path_Key trueline above ensures that file names are included in the log records emitted by Fluent Bit.The
Refresh_Interval 5line asks Fluent Bit to refresh the list of files in the log directory once per 5 seconds, rather than the default 60. The reason is that the directory/tmp/ray/session_latest/logs/does not exist initially (Ray must create it first). Setting theRefresh_Intervallow allows us to see logs in the Fluent Bit container’s stdout sooner.
Adding logging sidecars to RayCluster Custom Resource (CR)#
Adding log and config volumes#
For each pod template in our RayCluster CR, we need to add two volumes: One volume for Ray’s logs and another volume to store Fluent Bit configuration from the ConfigMap applied above.
        volumes:
        - name: ray-logs
          emptyDir: {}
        - name: fluentbit-config
          configMap:
            name: fluentbit-config
Mounting the Ray log directory#
Add the following volume mount to the Ray container’s configuration.
          volumeMounts:
          - mountPath: /tmp/ray
            name: ray-logs
Adding the Fluent Bit sidecar#
Finally, add the Fluent Bit sidecar container to each Ray pod config in your RayCluster CR.
        - name: fluentbit
          image: fluent/fluent-bit:1.9.6
          # These resource requests for Fluent Bit should be sufficient in production.
          resources:
            requests:
              cpu: 100m
              memory: 128Mi
            limits:
              cpu: 100m
              memory: 128Mi
          volumeMounts:
          - mountPath: /tmp/ray
            name: ray-logs
          - mountPath: /fluent-bit/etc/fluent-bit.conf
            subPath: fluent-bit.conf
            name: fluentbit-config
Mounting the ray-logs volume gives the sidecar container access to Ray’s logs.
The fluentbit-config
Putting everything together#
Putting all of the above elements together, we have the following yaml configuration for a single-pod RayCluster will a log-processing sidecar.
# Fluent Bit ConfigMap
apiVersion: v1
kind: ConfigMap
metadata:
  name: fluentbit-config
data:
  fluent-bit.conf: |
    [INPUT]
        Name tail
        Path /tmp/ray/session_latest/logs/*
        Tag ray
        Path_Key true
        Refresh_Interval 5
    [OUTPUT]
        Name stdout
        Match *
---
# RayCluster CR with a FluentBit sidecar
apiVersion: ray.io/v1alpha1
kind: RayCluster
metadata:
  labels:
    controller-tools.k8s.io: "1.0"
  name: raycluster-complete-logs
spec:
  rayVersion: '2.3.0'
  headGroupSpec:
    rayStartParams:
      dashboard-host: '0.0.0.0'
    template:
      spec:
        containers:
        - name: ray-head
          image: rayproject/ray:2.3.0
          lifecycle:
            preStop:
              exec:
                command: ["/bin/sh","-c","ray stop"]
          # This config is meant for demonstration purposes only.
          # Use larger Ray containers in production!
          resources:
            limits:
              cpu: "1"
              memory: "1G"
            requests:
              cpu: "1"
              memory: "1G"
          # Share logs with Fluent Bit
          volumeMounts:
          - mountPath: /tmp/ray
            name: ray-logs
        # Fluent Bit sidecar
        - name: fluentbit
          image: fluent/fluent-bit:1.9.6
          # These resource requests for Fluent Bit should be sufficient in production.
          resources:
            requests:
              cpu: 100m
              memory: 128Mi
            limits:
              cpu: 100m
              memory: 128Mi
          volumeMounts:
          - mountPath: /tmp/ray
            name: ray-logs
          - mountPath: /fluent-bit/etc/fluent-bit.conf
            subPath: fluent-bit.conf
            name: fluentbit-config
        # Log and config volumes
        volumes:
        - name: ray-logs
          emptyDir: {}
        - name: fluentbit-config
          configMap:
            name: fluentbit-config
Deploying a RayCluster with logging sidecar#
To deploy the configuration described above, deploy the KubeRay Operator if you haven’t yet: Refer to the Getting Started guide for instructions on this step.
Now, run the following commands to deploy the Fluent Bit ConfigMap and a single-pod RayCluster with a Fluent Bit sidecar.
kubectl apply -f https://raw.githubusercontent.com/ray-project/ray/releases/2.4.0/doc/source/cluster/kubernetes/configs/ray-cluster.log.yaml
Determine the Ray pod’s name with
kubectl get pod | grep raycluster-complete-logs
Examine the FluentBit sidecar’s STDOUT to see logs for Ray’s component processes.
# Substitute the name of your Ray pod.
kubectl logs raycluster-complete-logs-head-xxxxx -c fluentbit
Set up logging on a DaemonSet with Fluent Bit#
Fluent Bit is a lightweight agent that allows you to collect logs from your Kubernetes cluster and send them to a variety of destinations such as Elasticsearch, CloudWatch, S3, etc. The following steps set up Fluent Bit as a DaemonSet to send logs to CloudWatch Logs.
Setup for AWS EKS#
Create an Amazon EKS cluster named fluent-bit-demo in us-west-2 region using eksctl, as shown in the EKS docs.
eksctl create cluster --name fluent-bit-demo --region us-west-2
View your cluster nodes:
$ kubectl get nodes -o wide
NAME                                          STATUS   ROLES    AGE    VERSION               INTERNAL-IP     EXTERNAL-IP      OS-IMAGE         KERNEL-VERSION                  CONTAINER-RUNTIME
ip-192-168-59-62.us-west-2.compute.internal   Ready    <none>   157m   v1.27.5-eks-43840fb   192.168.59.62   54.190.144.241   Amazon Linux 2   5.10.192-183.736.amzn2.x86_64   containerd://1.6.19
ip-192-168-86-99.us-west-2.compute.internal   Ready    <none>   157m   v1.27.5-eks-43840fb   192.168.86.99   34.219.16.107    Amazon Linux 2   5.10.192-183.736.amzn2.x86_64   containerd://1.6.19
EKS cluster nodes need to have access to CloudWatch Logs for Fluent Bit.
Attach the CloudWatchLogsFullAccess policy to the IAM role that is attached to the cluster nodes:
ROLE_NAME=$(eksctl get nodegroup --cluster fluent-bit-demo --region us-west-2 -o json | jq -r '.[].NodeInstanceRoleARN' | cut -f2 -d/)

aws iam attach-role-policy \
  --role-name $ROLE_NAME \
  --policy-arn arn:aws:iam::aws:policy/CloudWatchLogsFullAccess
Deploy Fluent Bit DaemonSet#
If you don’t already have a namespace called amazon-cloudwatch, create one by entering the following command:
kubectl apply -f https://raw.githubusercontent.com/aws-samples/amazon-cloudwatch-container-insights/latest/k8s-deployment-manifest-templates/deployment-mode/daemonset/container-insights-monitoring/cloudwatch-namespace.yaml
Run the following command to create a ConfigMap named cluster-info with the cluster name and the Region to send logs to:
ClusterName=fluent-bit-demo
RegionName=us-west-2
FluentBitHttpPort='2020'
FluentBitReadFromHead='Off'
[[ ${FluentBitReadFromHead} = 'On' ]] && FluentBitReadFromTail='Off'|| FluentBitReadFromTail='On'
[[ -z ${FluentBitHttpPort} ]] && FluentBitHttpServer='Off' || FluentBitHttpServer='On'
kubectl create configmap fluent-bit-cluster-info \
    --from-literal=cluster.name=${ClusterName} \
    --from-literal=http.server=${FluentBitHttpServer} \
    --from-literal=http.port=${FluentBitHttpPort} \
    --from-literal=read.head=${FluentBitReadFromHead} \
    --from-literal=read.tail=${FluentBitReadFromTail} \
    --from-literal=logs.region=${RegionName} -n amazon-cloudwatch
Deploy the Fluent Bit DaemonSet to the cluster by running the following commands:
kubectl apply -f https://raw.githubusercontent.com/aws-samples/amazon-cloudwatch-container-insights/latest/k8s-deployment-manifest-templates/deployment-mode/daemonset/container-insights-monitoring/fluent-bit/fluent-bit.yaml
Validate whether you successfully deployed Fluent Bit by entering the following command:
kubectl -n amazon-cloudwatch logs ds/fluent-bit
Verify that the command created log groups:
...
[2023/10/10 06:13:55] [ info] [output:cloudwatch_logs:cloudwatch_logs.0] Created log group /aws/containerinsights/fluent-bit-demo/application
[2023/10/10 06:13:57] [ info] [output:cloudwatch_logs:cloudwatch_logs.2] Created log group /aws/containerinsights/fluent-bit-demo/host
[2023/10/10 06:13:57] [ info] [output:cloudwatch_logs:cloudwatch_logs.1] Created log group /aws/containerinsights/fluent-bit-demo/dataplane
...
Check the CloudWatch dashboard#
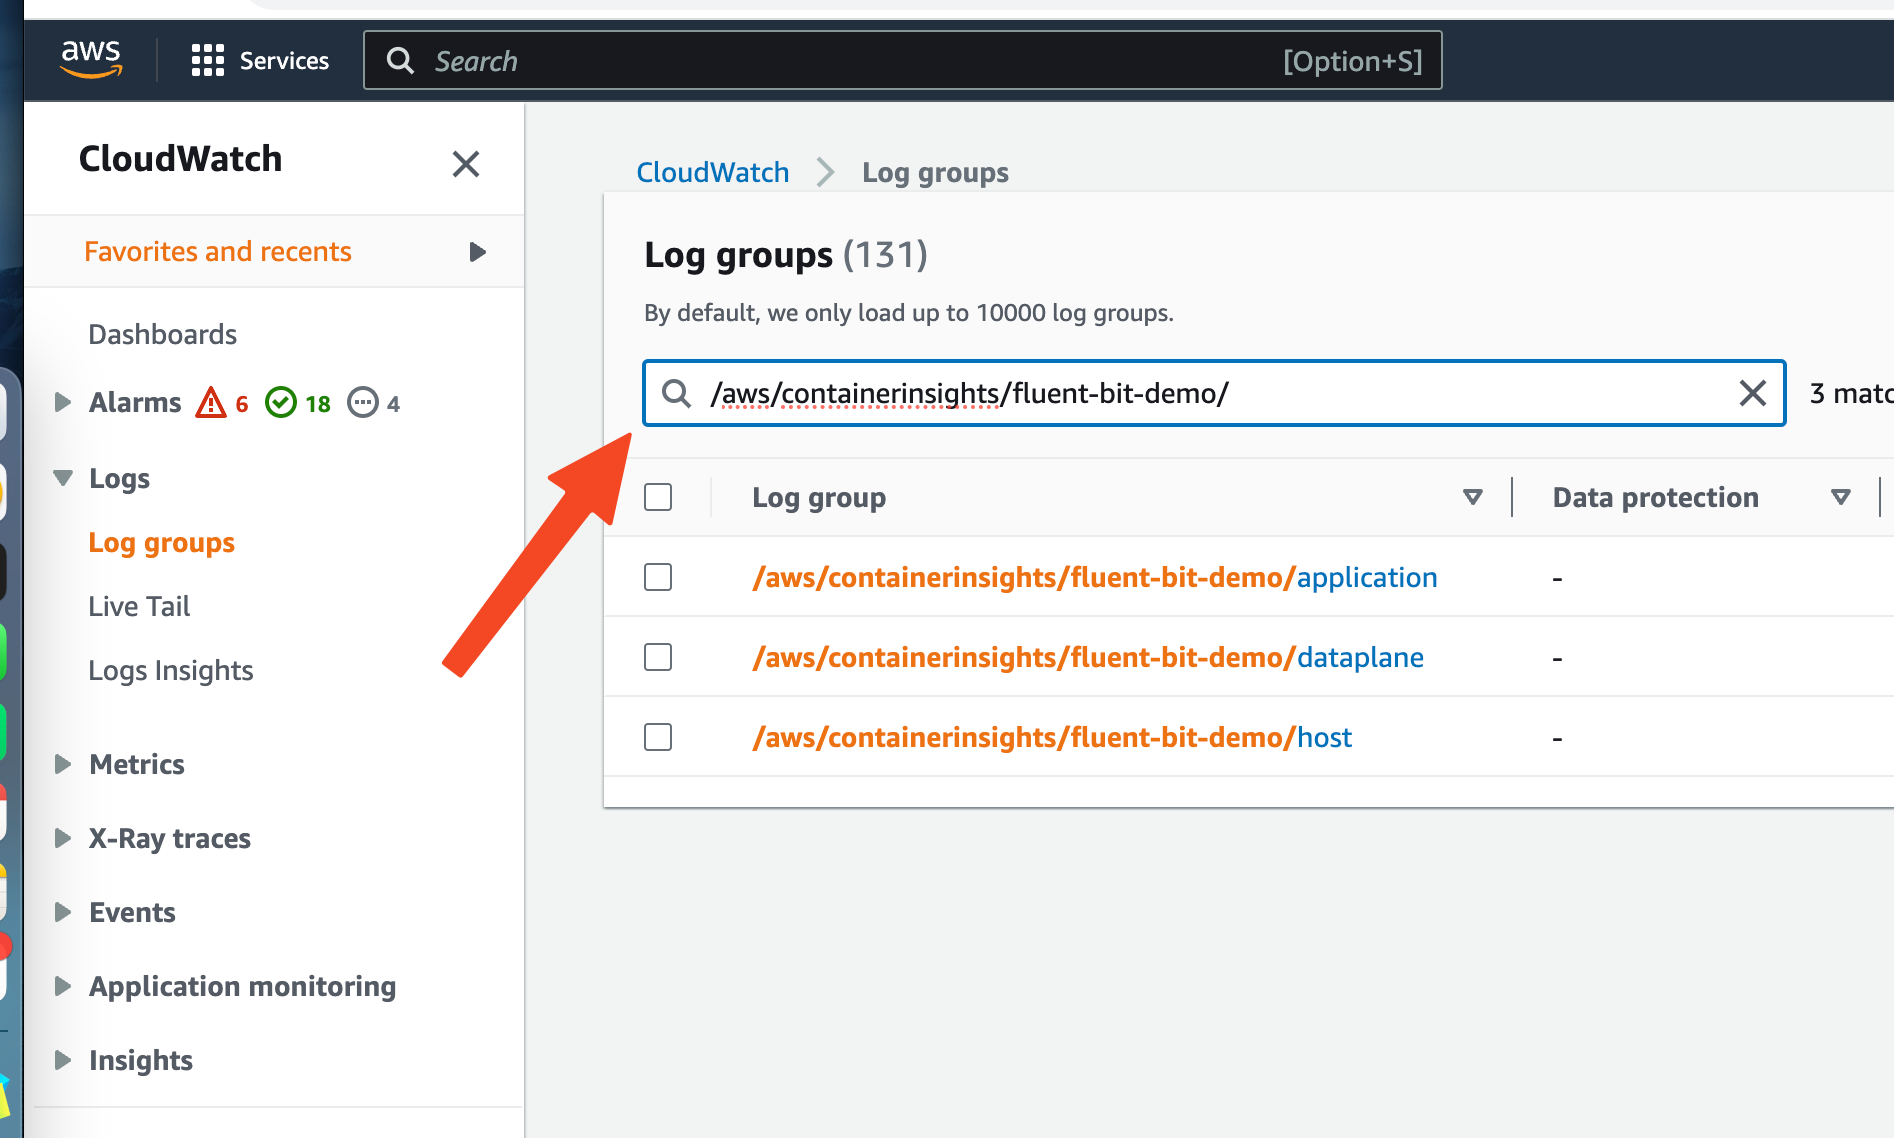
Finally, check the CloudWatch dashboard to see the logs. Open the CLoudWatch console at https://console.aws.amazon.com/cloudwatch/.
Type /aws/containerinsights/fluent-bit-demo/ in the search box.

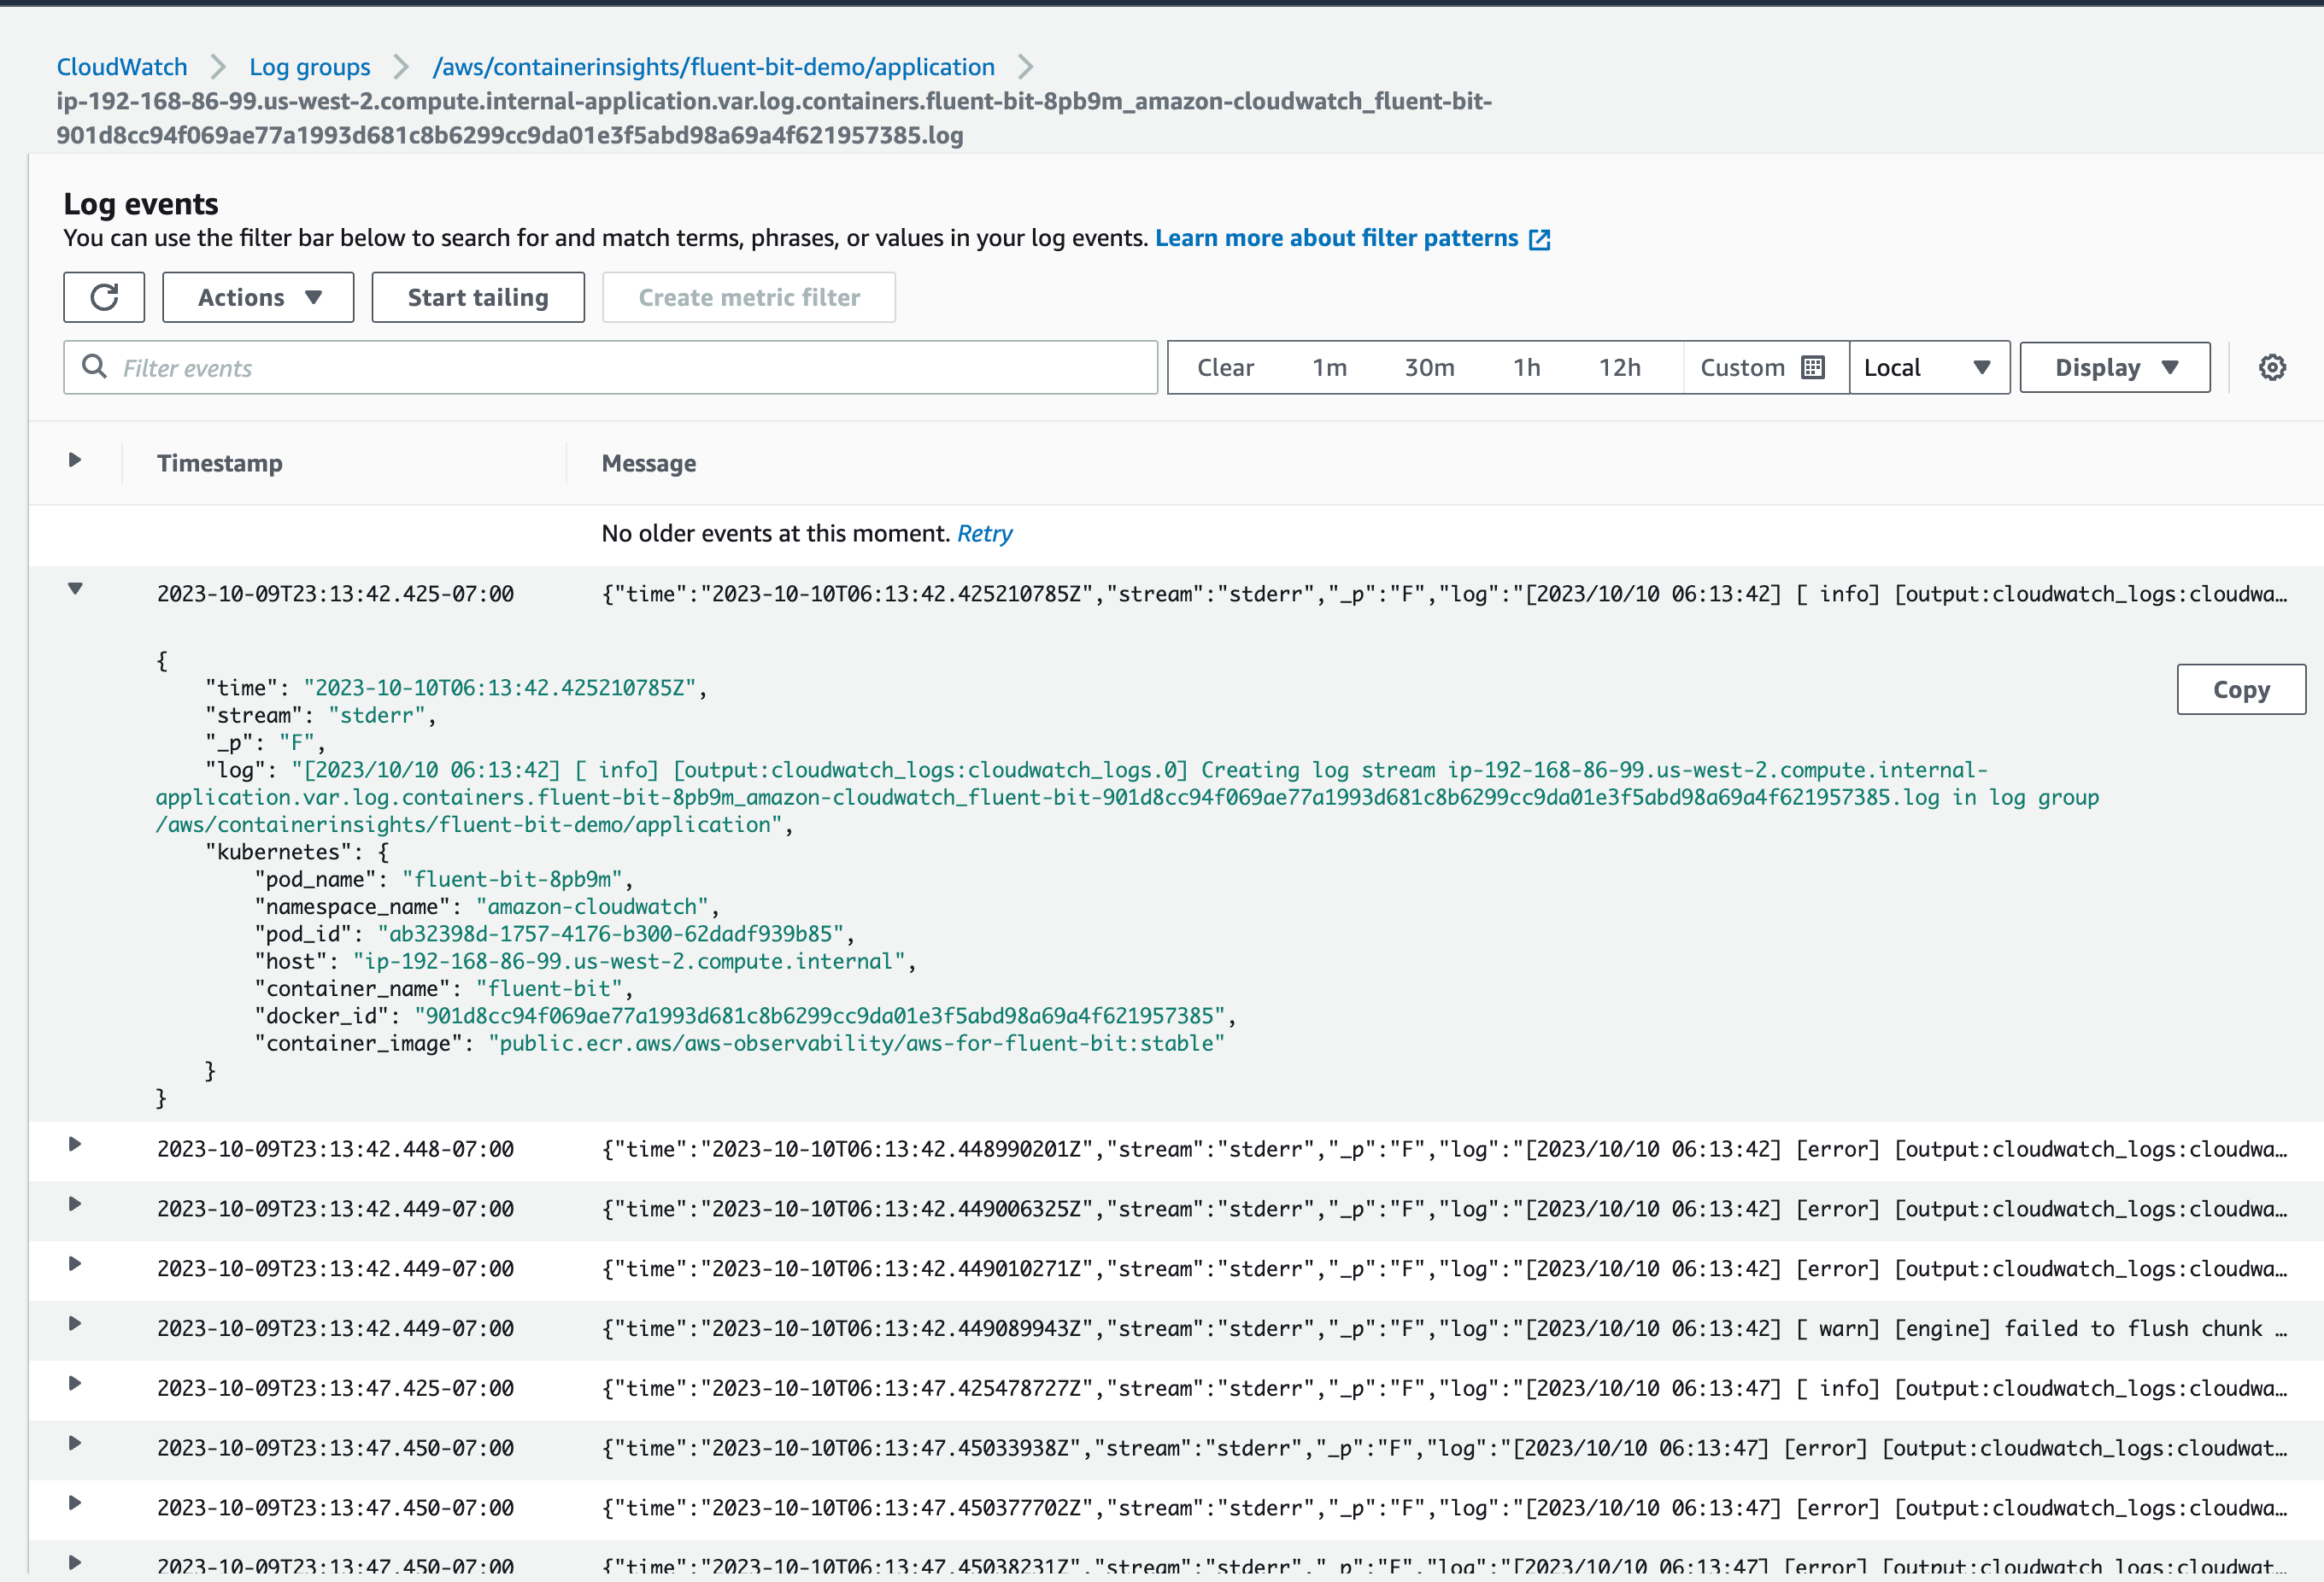
Select /aws/containerinsights/fluent-bit-demo/application. You should see the logs from the application pods including Ray.
Under the log streams, click any log stream. You should see the logs from the pods:

You can specify filters based on pod name, namespace, etc. Learn how to write filters in this filter pattern syntax doc.
Redirecting Ray logs to stderr#
By default, Ray writes logs to files in the /tmp/ray/session_*/logs directory.
If your log processing tool is capable of capturing log records written to stderr, you can redirect Ray logs to the stderr stream of Ray containers by setting the environment variable RAY_LOG_TO_STDERR=1 on all Ray nodes.
Alert: this practice isn’t recommended.
If RAY_LOG_TO_STDERR=1 is set, Ray doesn’t write logs to files.
Consequently, this behavior can cause some Ray features that rely on log files to malfunction.
For instance, worker log redirection to driver doesn’t work if you redirect Ray logs to stderr.
If you need these features, consider using the Fluent Bit solution mentioned above.
For clusters on VMs, don’t redirect logs to stderr. Instead, follow this guide to persist logs.
Redirecting logging to stderr also prepends a ({component}) prefix, for example, (raylet), to each log record message.
[2022-01-24 19:42:02,978 I 1829336 1829336] (gcs_server) grpc_server.cc:103: GcsServer server started, listening on port 50009.
[2022-01-24 19:42:06,696 I 1829415 1829415] (raylet) grpc_server.cc:103: ObjectManager server started, listening on port 40545.
2022-01-24 19:42:05,087 INFO (dashboard) dashboard.py:95 -- Setup static dir for dashboard: /mnt/data/workspace/ray/python/ray/dashboard/client/build
2022-01-24 19:42:07,500 INFO (dashboard_agent) agent.py:105 -- Dashboard agent grpc address: 0.0.0.0:49228
These prefixes allow you to filter the stderr stream of logs by the component of interest. Note, however, that multi-line log records don’t have this component marker at the beginning of each line.
Follow the steps below to set the environment variable RAY_LOG_TO_STDERR=1 on all Ray nodes
Start the cluster explicitly with CLI
env RAY_LOG_TO_STDERR=1 ray start
Start the cluster implicitly with ray.init
os.environ["RAY_LOG_TO_STDERR"] = "1"
ray.init()
Set the RAY_LOG_TO_STDERR environment variable to 1 in the Ray container of each Ray Pod.
Use this example YAML file as a reference.