Ray Distributed Debugger#
The Ray Distributed Debugger includes a debugger backend and a VS Code extension frontend that streamline the debugging process with an interactive debugging experience. The Ray Debugger enables you to:
Break into remote tasks: Set a breakpoint in any remote task. A breakpoint pauses execution and allows you to connect with VS Code for debugging.
Post-mortem debugging: When Ray tasks fail with unhandled exceptions, Ray automatically freezes the failing task and waits for the Ray Debugger to attach, allowing you to inspect the state of the program at the time of the error.
Ray Distributed Debugger abstracts the complexities of debugging distributed systems for you to debug Ray applications more efficiently, saving time and effort in the development workflow.
Note
The Ray Distributed Debugger frontend is only available in VS Code and other VS Code-compatible IDEs like Cursor. If you need support for other IDEs, file a feature request on GitHub.
Set up the environment#
Create a new virtual environment and install dependencies.
conda create -n myenv python=3.10
conda activate myenv
pip install "ray[default]" debugpy
Start a Ray cluster#
Run ray start --head to start a local Ray cluster.
Follow the instructions in the RayCluster quickstart to set up a cluster.
You need to connect VS Code to the cluster. For example, add the following to the ray-head container and make sure sshd is running in the ray-head container.
ports:
- containerPort: 22
  name: ssd
Note
How to run sshd in the ray-head container depends on your setup. For example you can use supervisord.
A simple way to run sshd interactively for testing is by logging into the head node pod and running:
sudo apt-get update && sudo apt-get install -y openssh-server
sudo mkdir -p /run/sshd
sudo /usr/sbin/sshd -D
You can then connect to the cluster via SSH by running:
kubectl port-forward service/raycluster-sample-head-svc 2222:22
After checking that ssh -p 2222 ray@localhost works, set up VS Code as described in the
VS Code SSH documentation.
Follow the instructions in the RayCluster quickstart to set up a cluster.
A simpler approach is to run a browser-based VS Code (Code Server) as a sidecar container in the Ray head pod. This eliminates network connectivity issues by placing VS Code inside the Kubernetes cluster.
Add a sidecar container to the Ray head pod and configure a shared volume. Modify your Ray head pod template with the following additions:
# In your RayCluster YAML, under spec.headGroupSpec.template.spec
containers:
  - name: ray-head
    # ... your existing ray-head configuration ...
    # Add this volumeMount:
    volumeMounts:
      - mountPath: /tmp/ray
        name: shared-ray-volume
  # Add this sidecar container:
  - name: vscode-debugger
    image: docker.io/onesizefitsquorum/code-server-with-ray-distributed-debugger:4.101.2
    ports:
      - containerPort: 8443
    volumeMounts:
      - mountPath: /tmp/ray
        name: shared-ray-volume
    env:
      # Specifies the default directory that opens when VSCode Web starts, pointing to the workspace containing the Ray runtime resources.
      - name: DEFAULT_WORKSPACE
        value: "/tmp/ray/session_latest/runtime_resources"
# Add this volume at the same level as `containers`:
volumes:
  - name: shared-ray-volume
    emptyDir: {}
After the Ray cluster is running, forward the Code Server port:
kubectl port-forward pod/<ray-head-pod-name> 8443:8443
Access VS Code in your browser at http://127.0.0.1:8443 and use the Ray Distributed Debugger extension to connect to http://127.0.0.1:8265.
For more details, see the Code Server with Ray Distributed Debugger project.
Register the cluster#
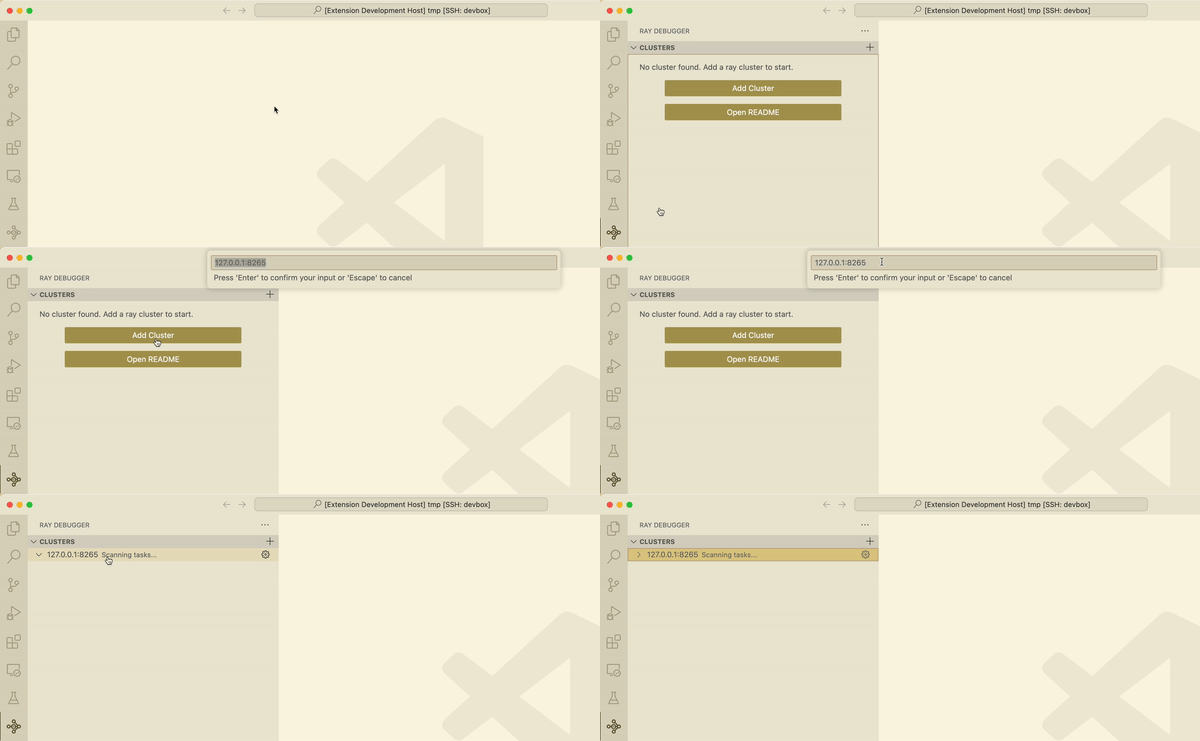
Find and click the Ray extension in the VS Code left side nav. Add the Ray cluster IP:PORT to the cluster list. The default IP:PORT is 127.0.0.1:8265. You can change it when you start the cluster. Make sure your current machine can access the IP and port.

Create a Ray task#
Create a file job.py with the following snippet. Add breakpoint() in the Ray task. If you want to use the post-mortem debugging below, also add the RAY_DEBUG_POST_MORTEM=1 environment variable.
import ray
import sys

# Add the RAY_DEBUG_POST_MORTEM=1 environment variable
# if you want to activate post-mortem debugging
ray.init(
    runtime_env={
        "env_vars": {"RAY_DEBUG_POST_MORTEM": "1"},
    }
)


@ray.remote
def my_task(x):
    y = x * x
    breakpoint()  # Add a breakpoint in the Ray task.
    return y


@ray.remote
def post_mortem(x):
    x += 1
    raise Exception("An exception is raised.")
    return x


if len(sys.argv) == 1:
    ray.get(my_task.remote(10))
else:
    ray.get(post_mortem.remote(10))
Run your Ray app#
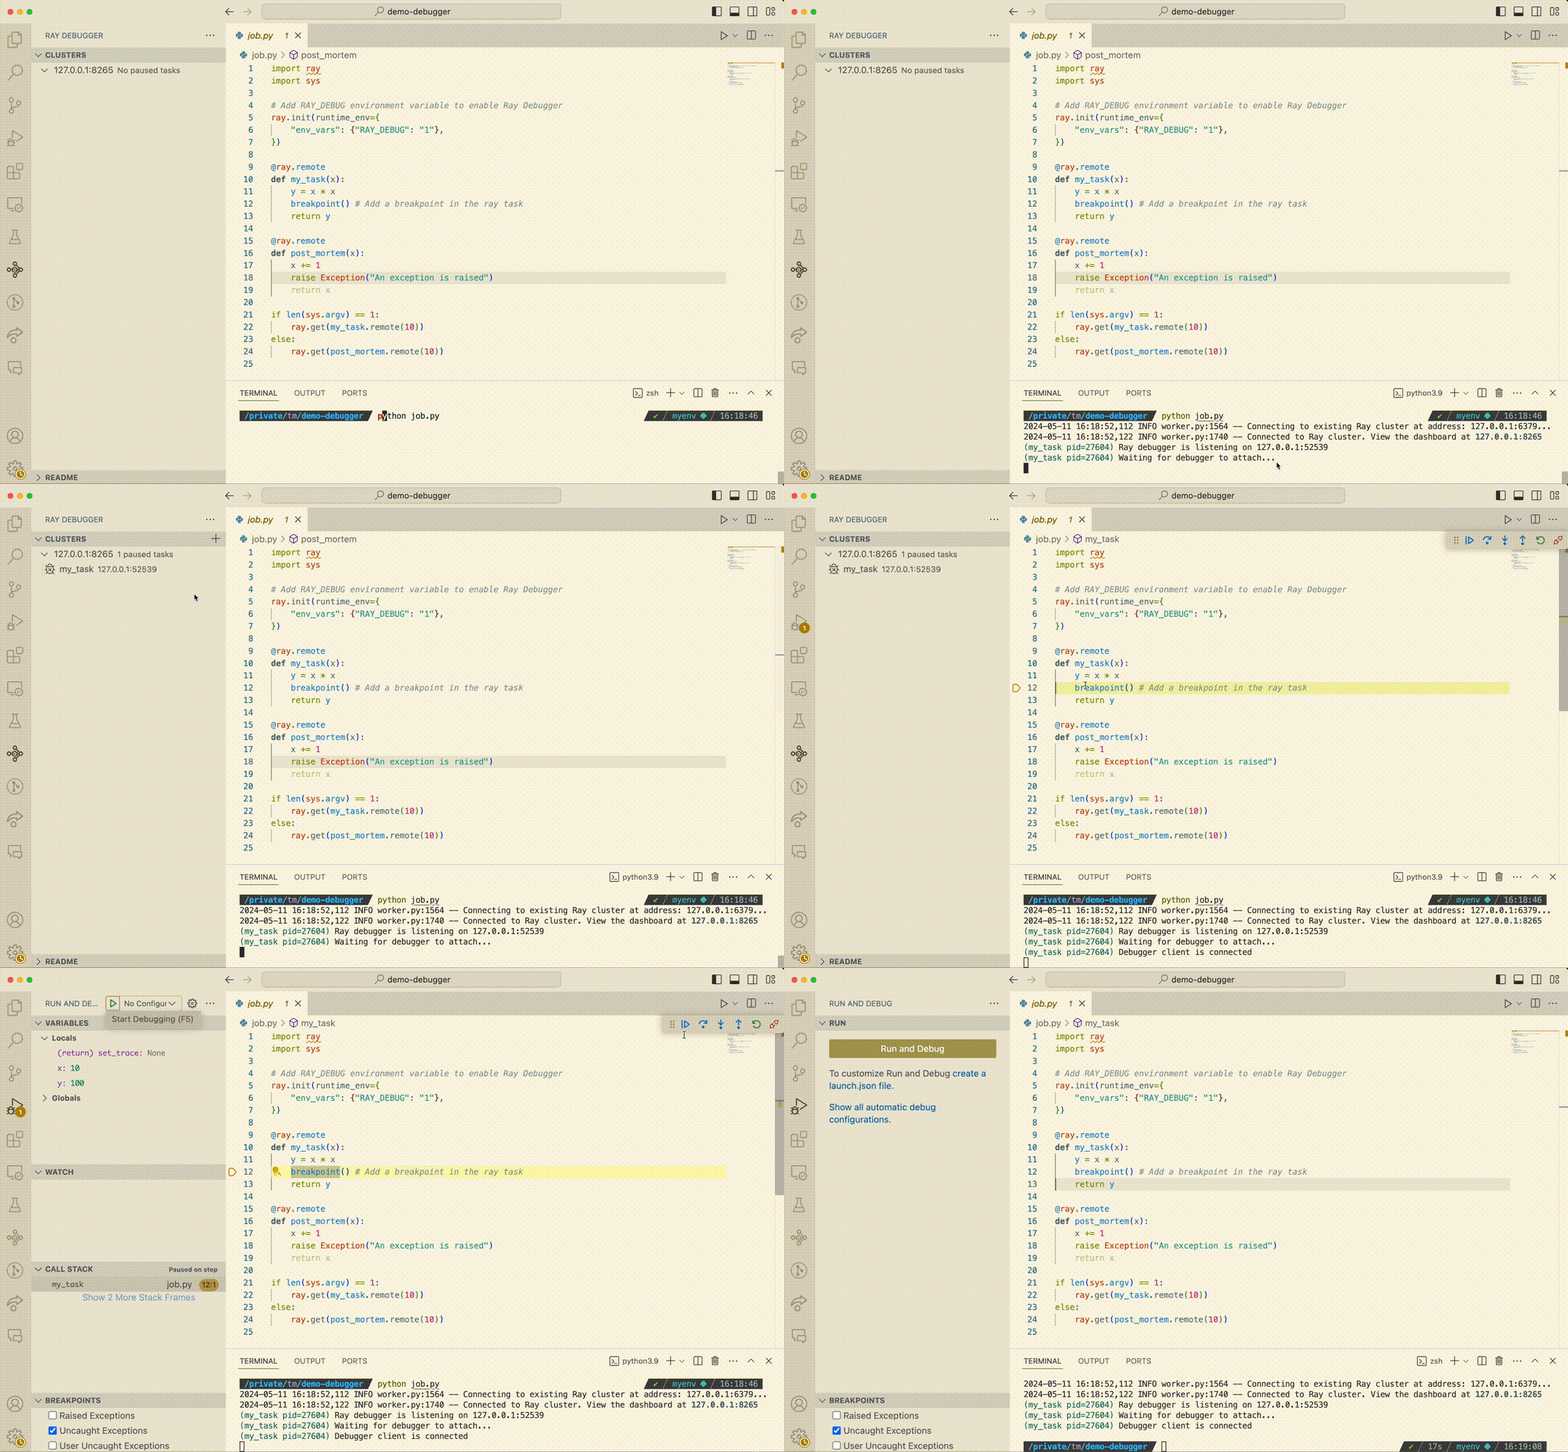
Start running your Ray app.
python job.py
Attach to the paused task#
When the debugger hits a breakpoint:
The task enters a paused state.
The terminal clearly indicates when the debugger pauses a task and waits for the debugger to attach.
The paused task is listed in the Ray Debugger extension.
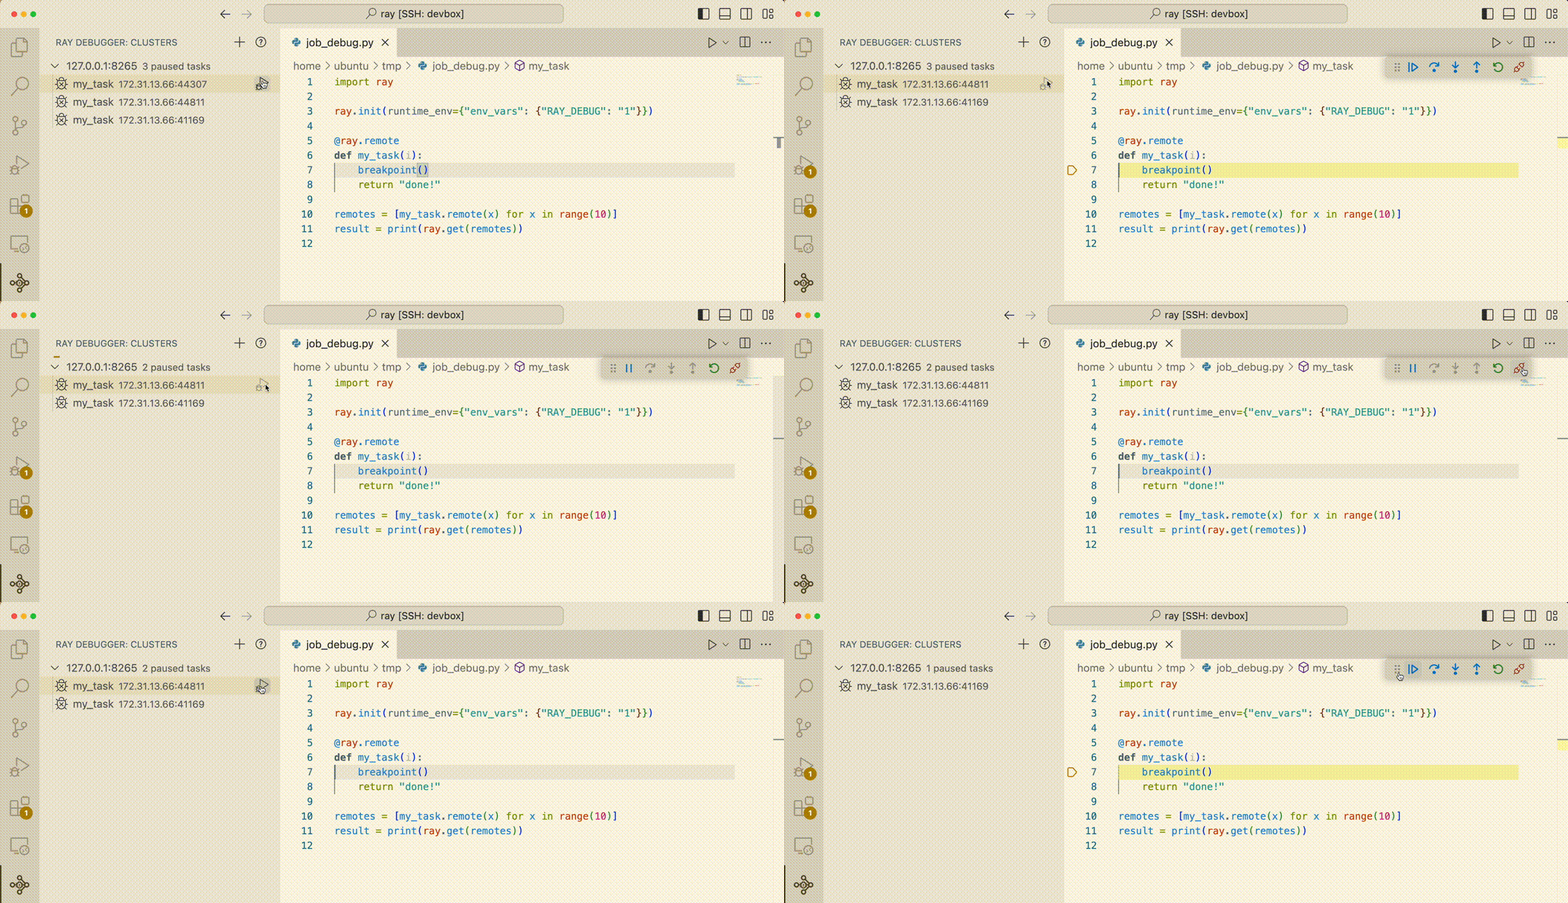
Click the play icon next to the name of the paused task to attach the VS Code debugger.

Start and stop debugging#
Debug your Ray app as you would when developing locally. After you’re done debugging this particular breakpoint, click the Disconnect button in the debugging toolbar so you can join another task in the Paused Tasks list.

Post-mortem debugging#
Use post-mortem debugging when Ray tasks encounter unhandled exceptions. In such cases, Ray automatically freezes the failing task, awaiting attachment by the Ray Debugger. This feature allows you to thoroughly investigate and inspect the program’s state at the time of the error.
Run a Ray task raised exception#
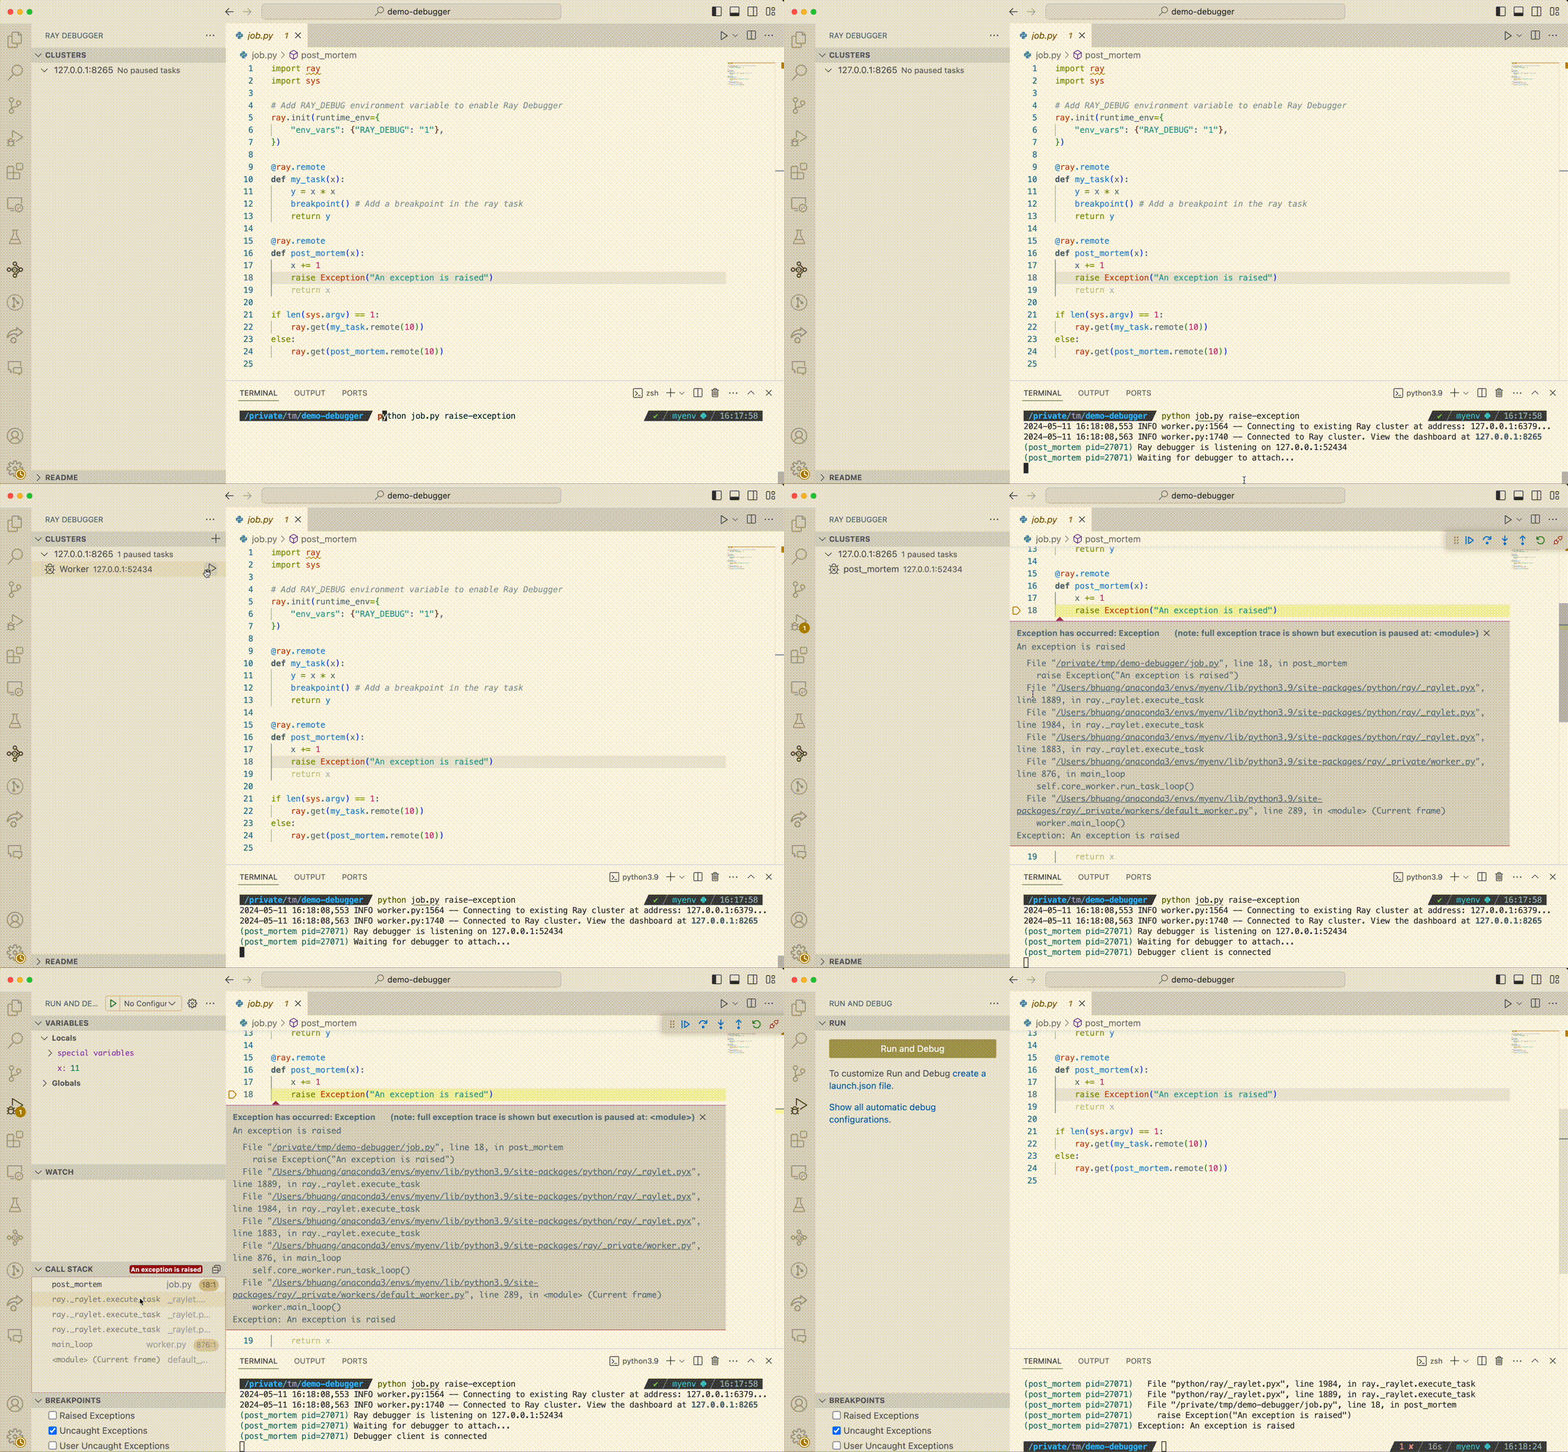
Run the same job.py file with an additional argument to raise an exception.
python job.py raise-exception
Attach to the paused task#
When the app throws an exception:
The debugger freezes the task.
The terminal clearly indicates when the debugger pauses a task and waits for the debugger to attach.
The paused task is listed in the Ray Debugger extension.
Click the play icon next to the name of the paused task to attach the debugger and start debugging.

Start debugging#
Debug your Ray app as you would when developing locally.
Next steps#
For guidance on debugging distributed apps in Ray, see General debugging.
For tips on using the Ray debugger, see Ray debugging.