Debugging Hangs#
View stack traces in Ray Dashboard#
The Ray dashboard lets you profile Ray Driver or Worker processes, by clicking on the “CPU profiling” or “Stack Trace” actions for active Worker processes, Tasks, Actors, and Job’s driver process.
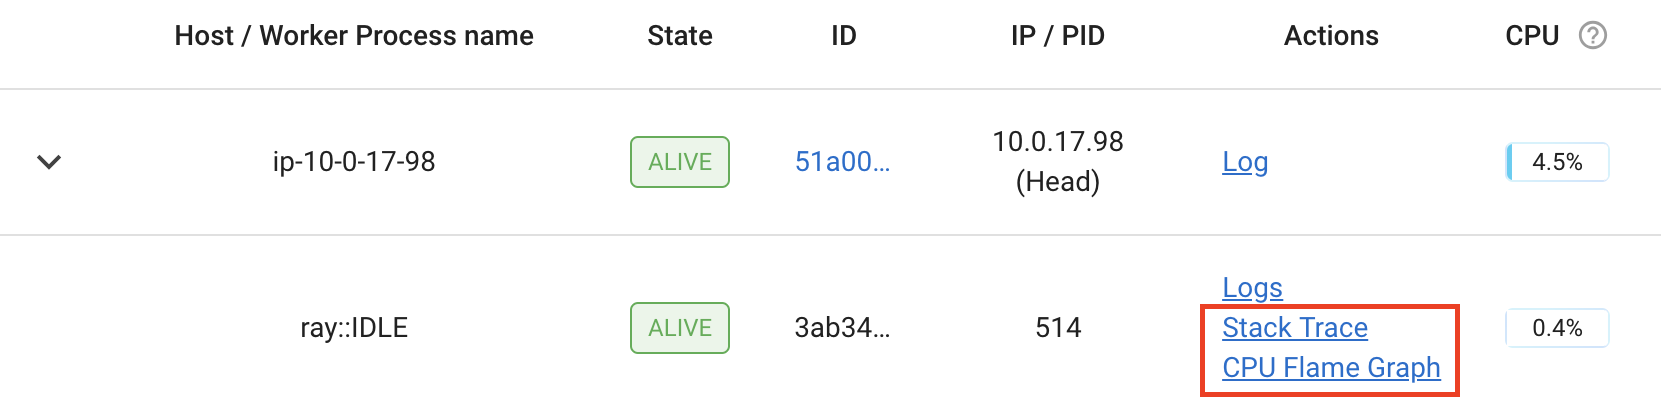
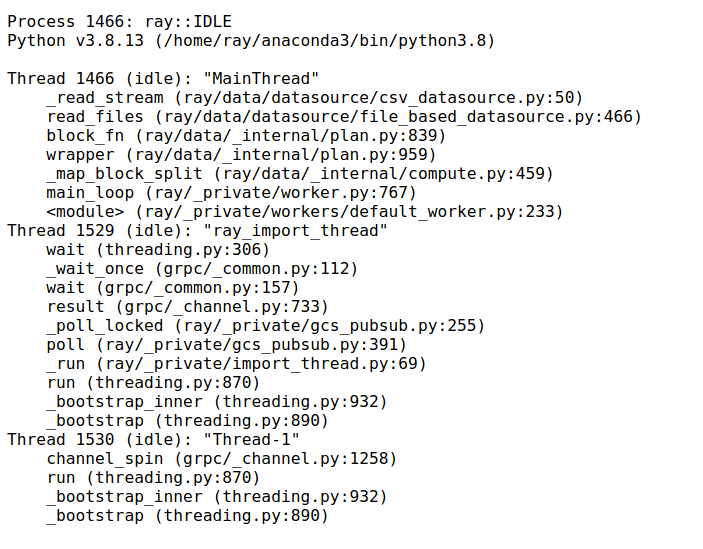
Clicking “Stack Trace” will return the current stack trace sample using py-spy. By default, only the Python stack
trace is shown. To show native code frames, set the URL parameter native=1 (only supported on Linux).
Note
You may run into permission errors when using py-spy in the docker containers. To fix the issue:
if you start Ray manually in a Docker container, follow the py-spy documentation to resolve it.
if you are a KubeRay user, follow the guide to configure KubeRay and resolve it.
Note
The following errors are conditional and not signals of failures for your Python programs:
If you see “No such file or direction”, check if your worker process has exited.
If you see “No stack counts found”, check if your worker process was sleeping and not active in the last 5s.
Use ray stack CLI command#
Once py-spy is installed (it is automatically installed if “Ray Dashboard” component is included when installing Ray), you can run ray stack to dump the stack traces of all Ray Worker processes on
the current node.
This document discusses some common problems that people run into when using Ray as well as some known problems. If you encounter other problems, please let us know.